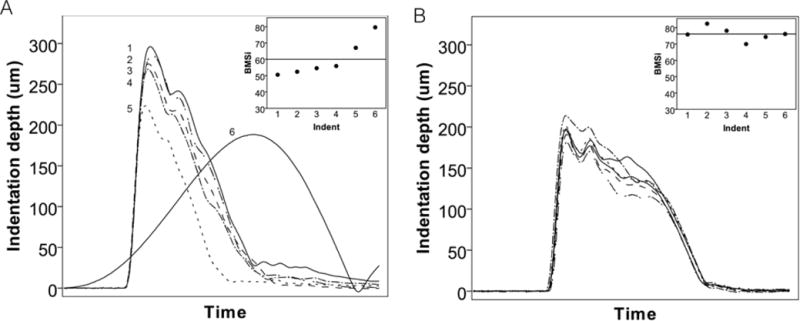
Figure 3.

Sample test curves from in vivo OsteoProbe tests in two skeletally mature beagle dogs. Curves were plotted using the stored raw data while the BMSi inset represents the raw data provided by the machine during the actual testing session. (A) This animal had four consistent BMSi values followed by two that were notably higher. Examining the curves (post-testing) revealed that while indent 5 had a normal shape, indent 6 was distinctly different and clearly not a valid test. Distinguishing whether either test 5 or 6 are ‘valid’ based on BMSi is challenging as although these values are higher than the mean for this animal, they are in line with values from a different animal (shown in B).
