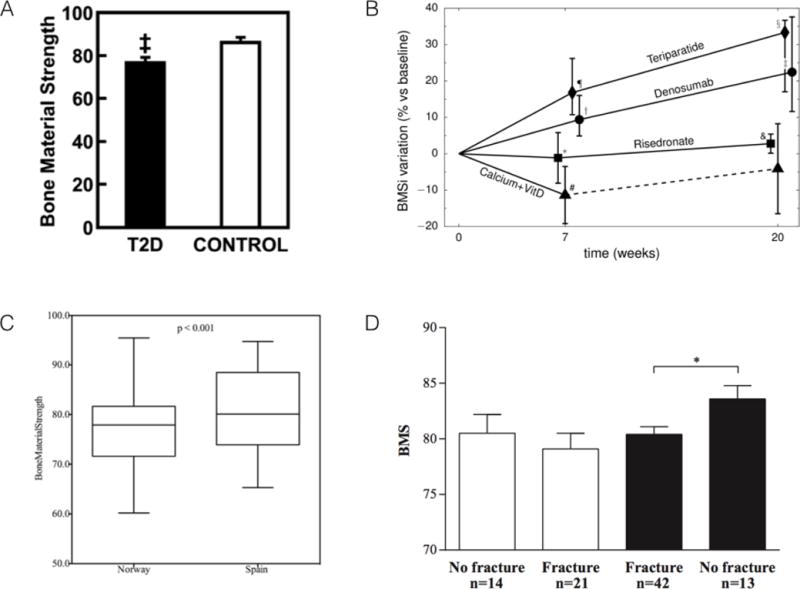
Figure 5.

Key figures from each of the four clinical papers using OsteoProbe. (A) BMS is significantly lower in patients with type 2 diabetes (T2D) compared to control. (B) Changes in BMSi over time in patients treated with a combination of glucocorticoids and various other interventions (see text for details). (C) Difference in BMSi between subjects from Norway and Spain – populations known to have different fracture risks. (D) BMSi values for osteoporotic (white bars) and osteopenic (dark bars) patients with and without fracture. Note, despite figure axes using the term Bone Material Strength (or BMS), this is the same as BMSi, which is the more conventional term for this variable. Figures reproduced with permission from(29,34,39,40).
