
Figure 3.
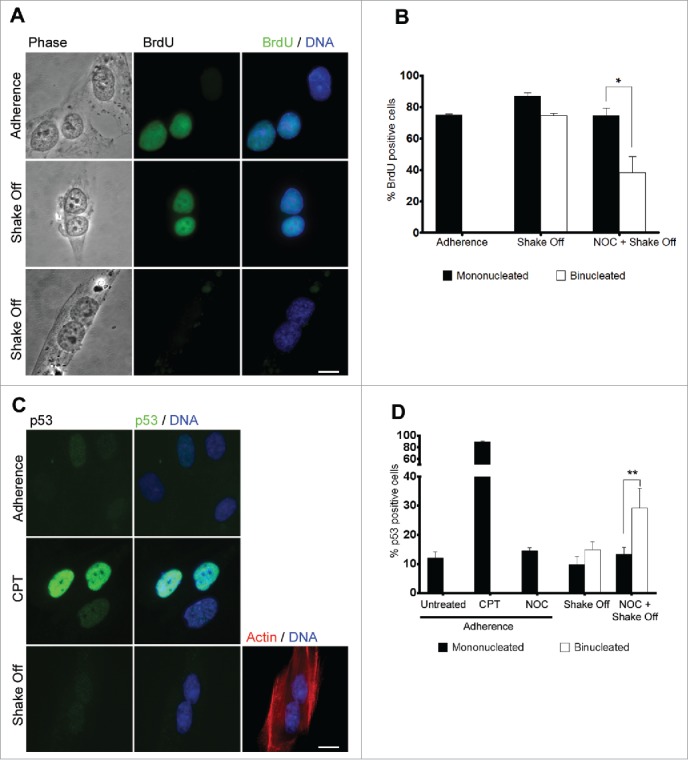
Binucleated cells induced by cytokinesis in suspension progress through S phase. (A) Representative images of BrdU incorporation in mononucleated cells grown in adherence or in binucleated cells obtained 20 hrs after cytokinesis in suspension. (B) Frequency of BrdU-positive cells among mononucleated cells grown in adherence and mononucleated or binucleated cells obtained 20 hrs after cytokinesis in suspension (Shake off) or after cytokinesis in suspension with a 3 hr NOC pre-treatment (NOC + Shake off). Results shown are the mean ± SEM of 3 independent experiments. For each experiment at least 200 mononucleated cells were analyzed in adherence condition, 200 mononucleated and 50 binucleated cells after cytokinesis in suspension. (C) Representative images of p53 immunostaining in cells grown in adherence (Adherence), after camptothecin treatment (CPT), or in binucleated cells obtained 20 hrs after cytokinesis in suspension (Shake off). Binucleation was confirmed by actin immunostaining. (D) Frequency of p53-positive cells in cells grown in adherence (untreated), after camptothecin treatment (CPT) or nocodazole exposure (NOC) in adherence, and in mononucleated or binucleated cells obtained 20 hrs after cytokinesis in suspension (Shake off) or after cytokinesis in suspension with a 3hr NOC pre-treatment (NOC + Shake off). Results shown are the mean ± SEM of 3 independent experiments. For each experiment at least 500 mononucleated cells were analyzed in adherence conditions, 200 mononucleated and 50 binucleated cells after cytokinesis in suspension. *P<0.05; **P<0.01 (Student's t-test). Scale bar = 5 μm.