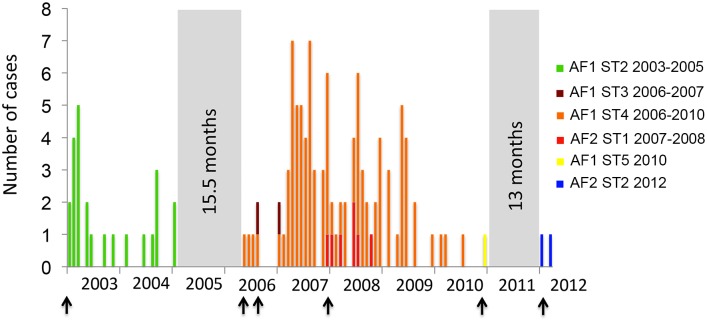
Fig 3. Temporal distribution of RABV subtypes in Bangui as determined by the MCC analysis (number of specimens positive for rabies by months from January 2003 to March 2012 and same color code as in Fig 2).
Black arrows indicates RABV introduction events in the city (first introduction of a new subtype circulating in Bangui). Grey areas indicated periods without any reported cases.

