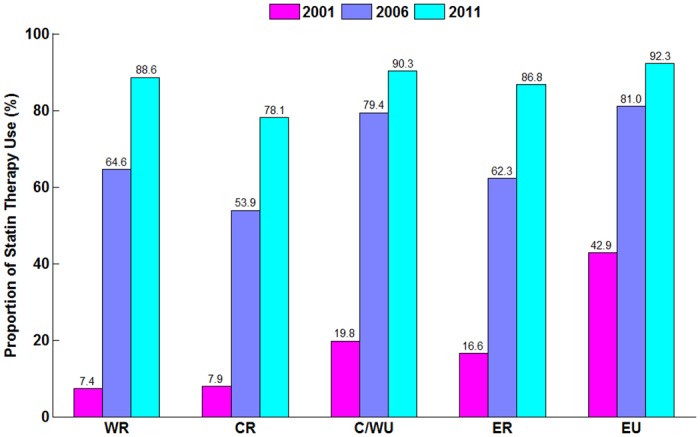
Fig 2. Proportion of Patients Receiving Statin therapy Stratified by Region.

P for trend <0.001 for the proportion of statin therapy in 2001, 2006 and 2011.P for trend <0.001 for the proportion of statin therapy in different regions.WR indicates Western rural; CR indicates Central rural; ER indicates Eastern rural; C/WU indicates Central/Western urban; EU indicates Eastern urban.
