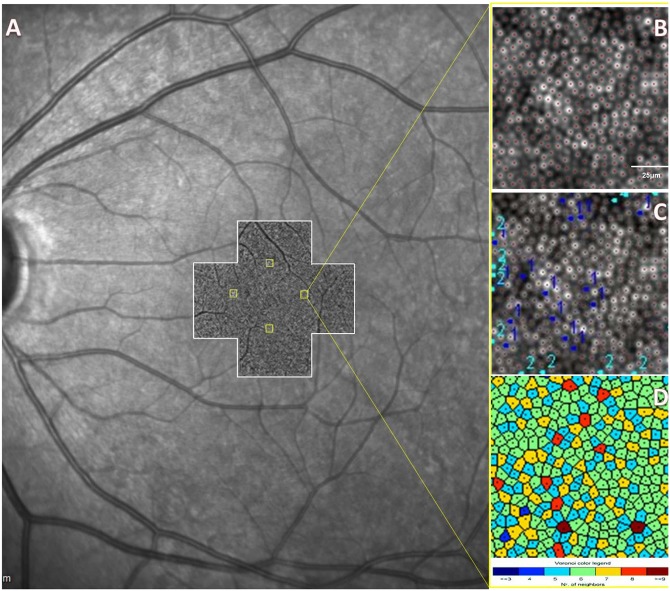
Fig 1. Position of the Regions of Interest (ROIs) with Respect to the Fovea.
A: Scanning laser ophthalmoscope (SLO) image of the left eye of a healthy control. AO images (white-bordered cross centered at the fovea), taken at 0° and 2° along the vertical and horizontal meridians, are stitched and superimposed on the SLO image. Four 100×100-μm squares are placed 500-μm (yellow squares) from the foveal center within the 4 retinal quadrants. B: Magnified AO image of the temporal 500-μm eccentricity square. AOdetect® software recognizes and counts the cells marked by red dots. C: Example of manual correction of the automated counts by one grader (1, missed cones; 2, cones erroneously counted by the automated software). D: Color map of Voronoi tiles.

