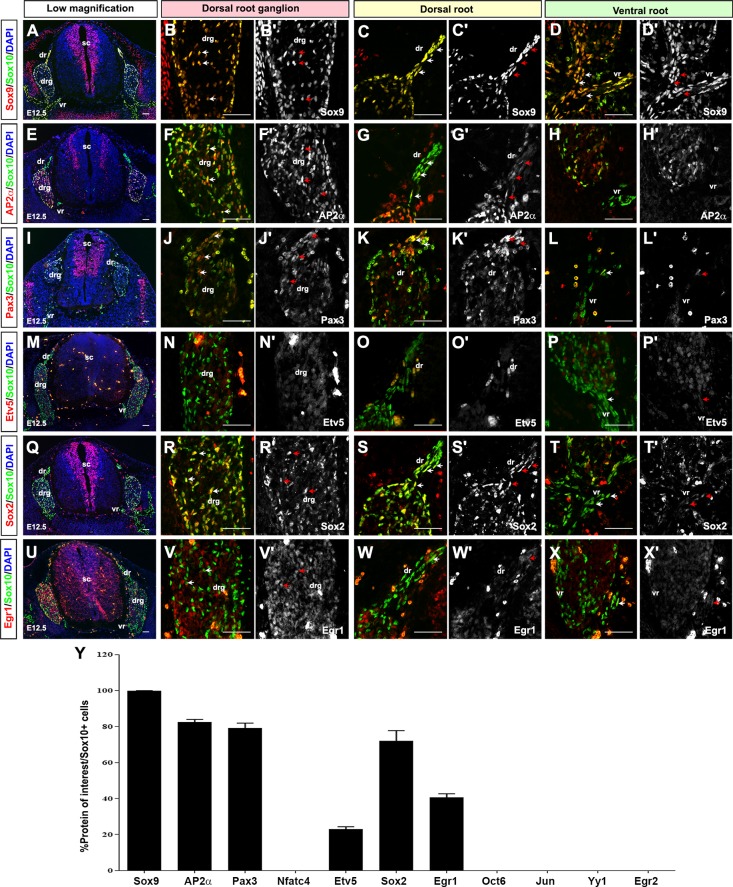
Fig 4. Expression of SC lineage markers in E12.5 SCPs.
(A-Y) Co-expression of Sox10 with Sox9 (A-D'), AP2α (E-H'), Pax3 (I-L'), Etv5 (M-P'), Sox2 (Q-T'), and Egr1 (U-X') in transverse sections through the E12.5 trunk. Low magnification merged images of protein of interest (red) and Sox10 (green) (A,E,I,M,Q,U). Blue is DAPI counterstain. High magnification images of the DRG, showing merged images of the protein of interest (red) and Sox10 (green) (B,F,J,N,R,V), and single protein of interest images in white (B',F',J',N',R',V'). High magnification images of the dorsal roots, showing merged images of the protein of interest (red) and Sox10 (green) (C,G,K,O,S,W), and single protein of interest images in white (C',G',K',O',S',W'). High magnification images of the ventral roots, showing merged images of the protein of interest (red) and Sox10 (green) (D,H,L,P,T,X), and single protein of interest images in white (D',H',L',P',T',X'). Arrows indicate co-expression of proteins of interest with Sox10 in SCPs. Quantification of percentage of Sox10+ cells that co-express each of the proteins of interest (Y). Error bars = S.E.M. dr, dorsal root; drg, dorsal root ganglion; sc, spinal cord; scg, sympathetic chain ganglion; sn, spinal nerve; vr, ventral root. Scale bars, 60μm.

