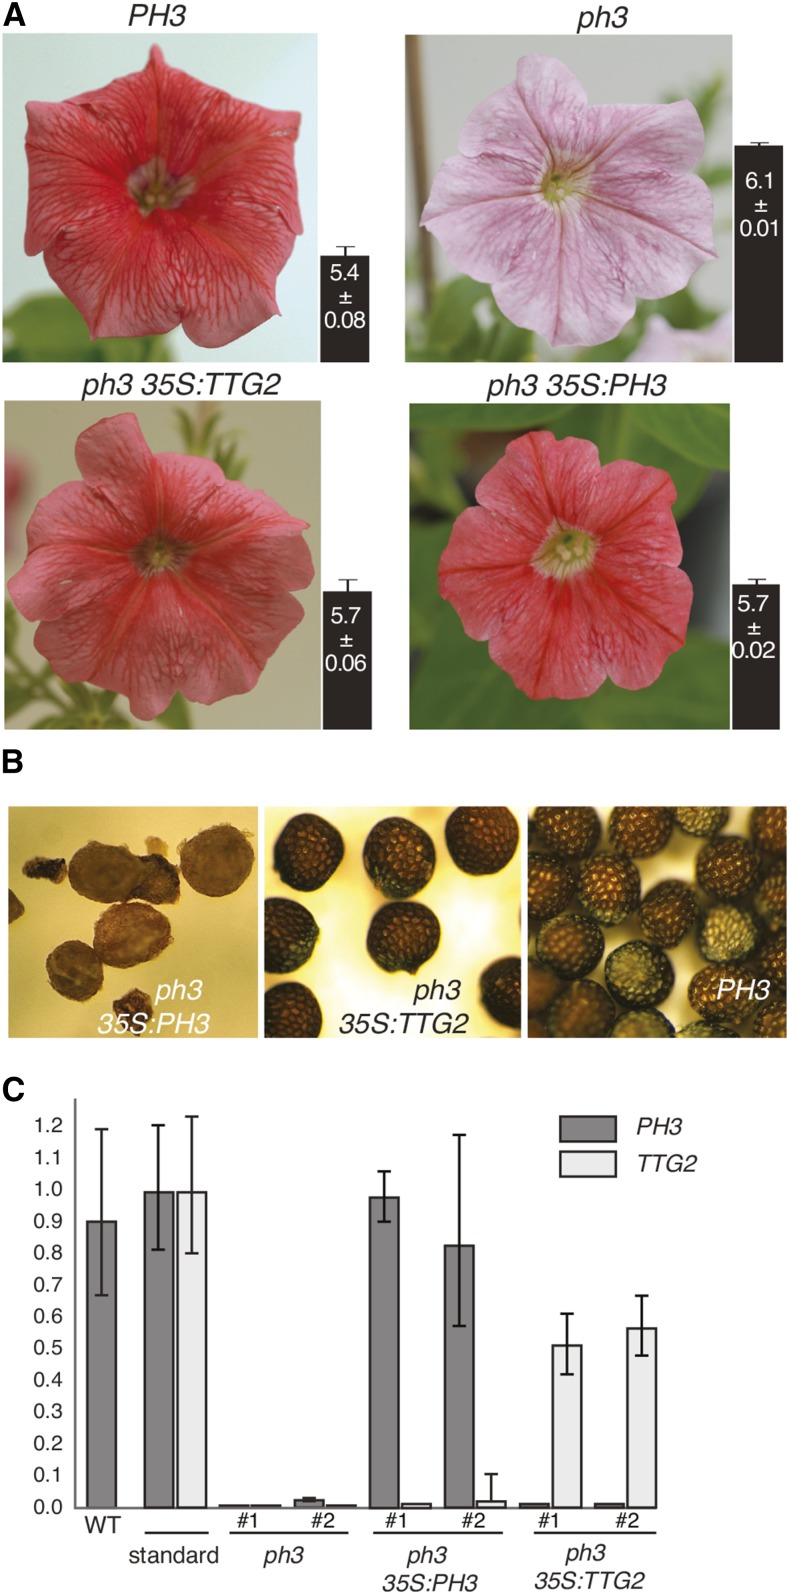
Figure 5.
Expression of p35S:PH3 and p35S:TTG2 in Petunia.
(A) Flowers of PH3 wild type, ph3 mutant, and ph3 mutants complemented by p35S:PH3 or p35S:TTG2. The pH values of the crude petal extract are indicated by the bars next to the pictures (mean ± sd, n = 4).
(B) Seeds of ph3 p35S:PH3 and ph3 p35S:TTG2 transformants with red petals and a PH3+ line.
(C) Real-time RT-PCR analysis of the expression of the PH3 endogene, p35S:PH3, and p35S:TTG2 in four transgenic lines with red flowers (shown in [A]). The standards for PH3 and TTG2 were obtained by spiking leaf cDNA with 1 fg (10−15 g) of a PH3 or TTG2 cDNA fragment, respectively.

