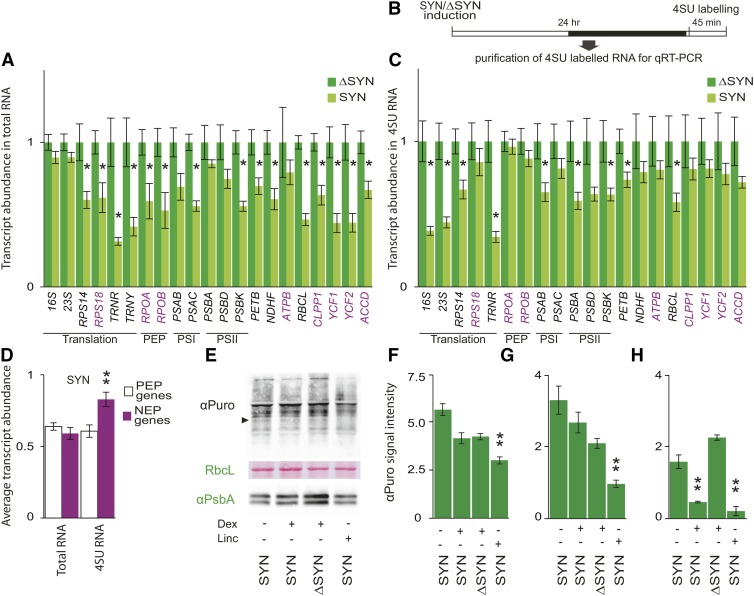
Figure 4.
ppGpp Accumulation Reduces Chloroplast Transcript Levels but Does Not Have a Major Direct Effect on Chloroplast Translation.
(A) qRT-PCR for selected chloroplast-encoded transcripts 24 h after the induction of ΔSYN and SYN seedlings grown on plates for 12 DAS. Transcripts produced only or significantly by NEP in green tissue (NEP genes) are indicated in purple, *P < 0.05, SYN versus ΔSYN for a single transcript. Data are presented as means ± se for four independent biological replicates, and transcript abundance was normalized to the nucleus-encoded 18S, APT1, PP2A, and ULP7 reference transcripts.
(B) and (C) The transcription rates of chloroplast genes in induced SYN and ΔSYN plants were measured by labeling new transcripts with 4SU in vivo (B) and quantifying the abundance of purified 4SU transcripts by qRT-PCR (C). Data are presented as means ± se for four independent biological replicates, and transcript abundance was normalized to 18S, PP2A, and ULP7 reference genes.
(D) The induction of SYN had significantly less effect on the transcription of NEP genes than it did on PEP genes; P = 0.0011, ANOVA with post-hoc Dunnett test, n = 8 to 11. Twenty-four fours after induction of SYN and ΔSYN seedlings, translation rates were also analyzed by quantifying the incorporation of puromycin into nascent proteins during 1 h.
(E) Puromycin incorporation was assessed by immunoblot analysis on equal quantities of total chloroplast proteins (10 µg) using an antibody against puromycin. Plants treated with lincomycin for 24 h were used as a control. The black arrow indicates PsbA. RbcL is a loading and transfer control and is shown by Ponceau red staining on the same membrane used for puromycin detection.
(F) Incorporation was quantified across five biological replicates. Lincomycin-treated SYN plants showed a significant drop in puromycin incorporation compared with induced SYN plants, **P < 0.01. No significant difference could be detected in the incorporation of puromycin between induced SYN and ΔSYN plants.
(G) and (H) Puromycin incorporation into PsbA was also quantified at 24 h (G) and 72 h (H) after treatment, **P < 0.01, versus ΔSYN. Samples were normalized to total chloroplast protein. Unless stated otherwise, significance was calculated using the two-way Student’s t test. Error bars indicate se.

