
Figure 2.
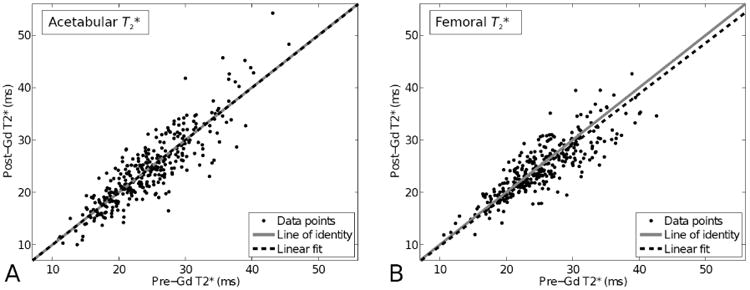
Scatterplots of the T2* relaxation times post-Gd vs. pre-Gd. A) Acetabular cartilage and B) femoral cartilage. Dots (•) denote the data points, solid gray line is the line of identity and dashed lines show the linear fits between pre-Gd and post-Gd T2* values.