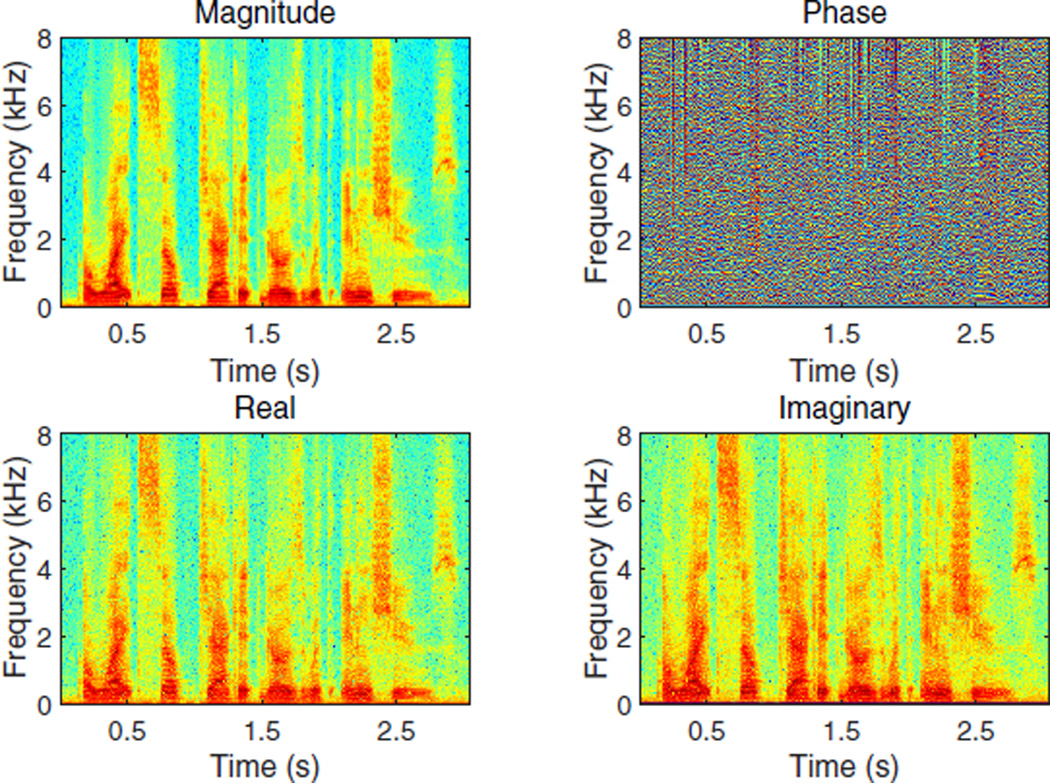
Fig. 1.
(Color online) Example magnitude (top-left) and phase (top-right) spectrograms, and real (bottom-left) and imaginary (bottom-right) spectrograms, for a clean speech signal. The real and imaginary spectrograms show temporal and spectral structure and are similar to the magnitude spectrogram. Little structure is exhibited in the phase spectrogram.

