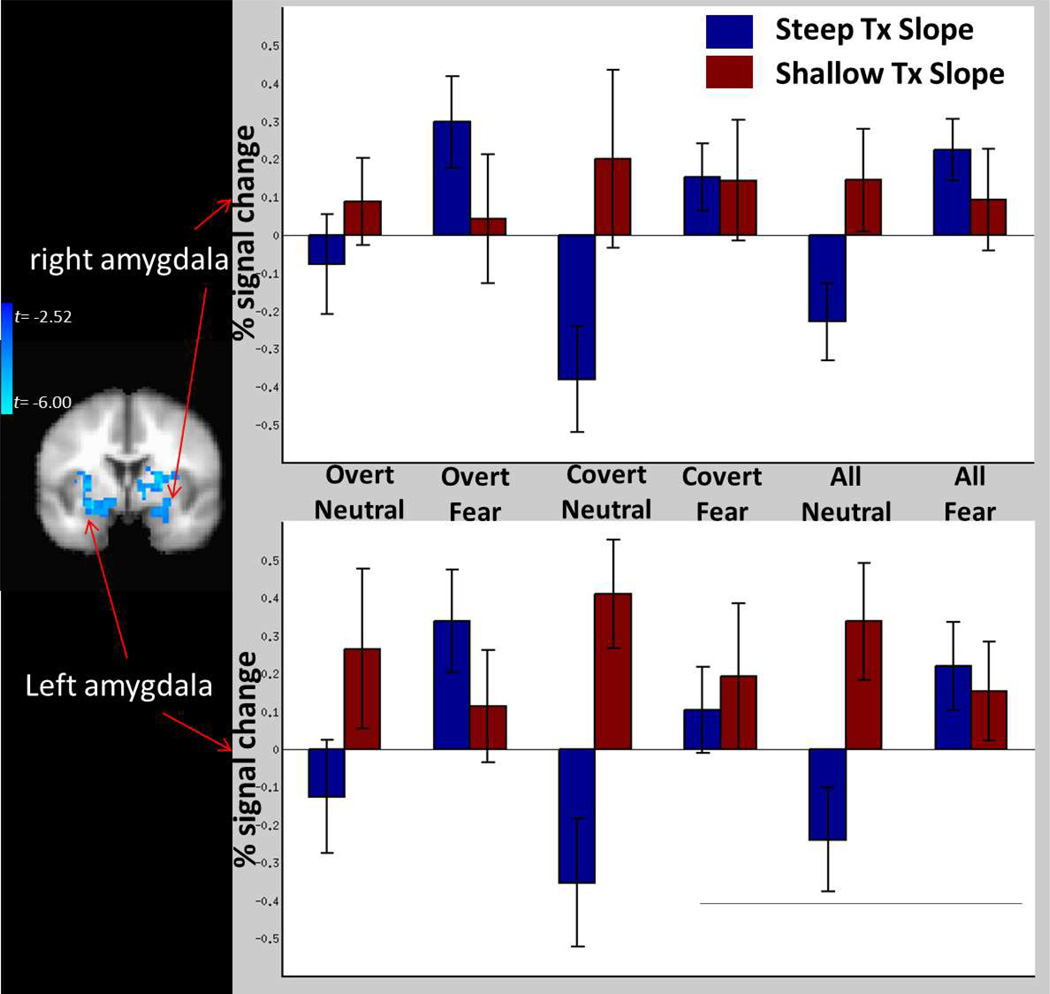
Figure 2.
Graphical depiction of activity for fear and neutral images separately as a function of shallow vs steep PTSD trajectory slopes across treatment and as a function of stimulus presentation formats, and scatter plots of scalar relationships between activity for the contrast of all fear vs neutral blocks and treatment slopes, for the right (top) and left (bottom) amygdala.

