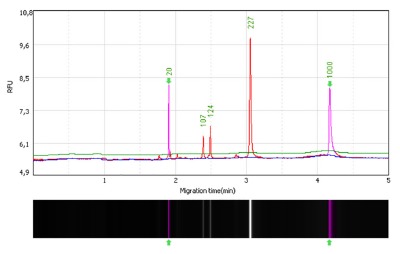
Fig. 1. - IL10 -3575 SNP (rs1800890) after RFLP. The heterozygous genotype (TA) generates fragments of 227, 124, 107 bp. The first image on the left displays the capillary electrophoresis analysis of the IL10 -3575 (T/A) SNP after RFLP performed with the ApoI enzyme. The image shows in the X axis, a sample carrying a heterozygous genotype (TA) generating, after RFLP, three fragments of 227, 124, 107 bp (in red); the alignment markers (20 to 1000 bp, in pink) and their corresponding migration times (in minutes). The electropherogram also shows the relative fluorescent unit (RFU) of each fragment (semi-quantitation results) in the Y axis. The second image (below) shows the three DNA fragments located within the region delineated by the alignment markers, as they would appear in an agarose gel.

