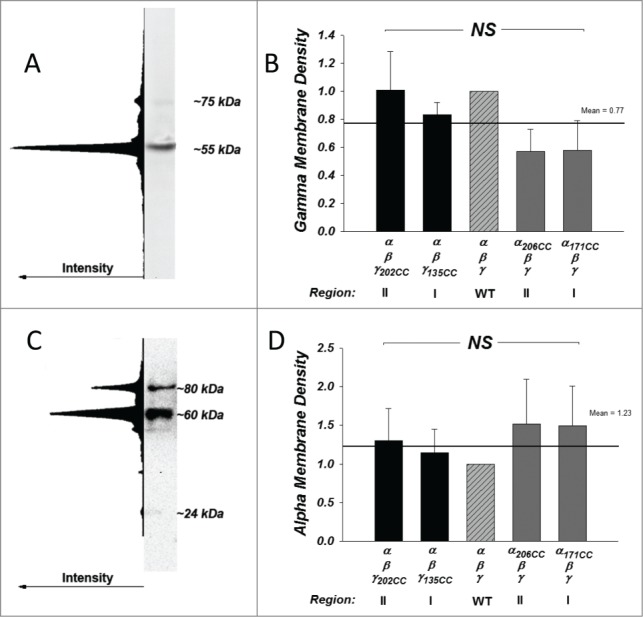
Figure 2.

Subunit expression and processing is unchanged with exogenous cysteines. Membrane expression and endogenous cleavage of the γ and α subunits was examined by SDS-PAGE and Western Blot. (A) A representative blot demonstrating that virtually all of γ appeared as a single cleaved form at 55 kDa (region II) with little to no appearance of the full form at 75 kDa. This example was purposely chosen to represent the one showing the highest 75 kDa expression. This is confirmed by the intensity profile of the entire lane. (B) γ expression was measured by densitometry and normalized to WT. No differences were observed among all groups (NS = not significant) indicating absence of effects on expression and processing. Line and numerical mean represent the average of all groups. N = 3–5. (C) A representative blot shows the pattern of expression in the α subunit. α appeared as at least 2 distinct bands at ˜80 and 60 kDa, representing the full length and region II protein. The small region I band was barely detectable and migrated at 24 kDa. This detection was feasible because α contained 2 HA tags one each in regions I and II (see Methods). (D) α expression was measured by densitometry and normalized to WT. Summarized data represent the sum of cleaved and uncleaved protein. Overall, the expression was not different among all groups (NS = not significant) indicating absence of effects on expression. Line and numerical mean represent the average of all groups. N = 5–9.
