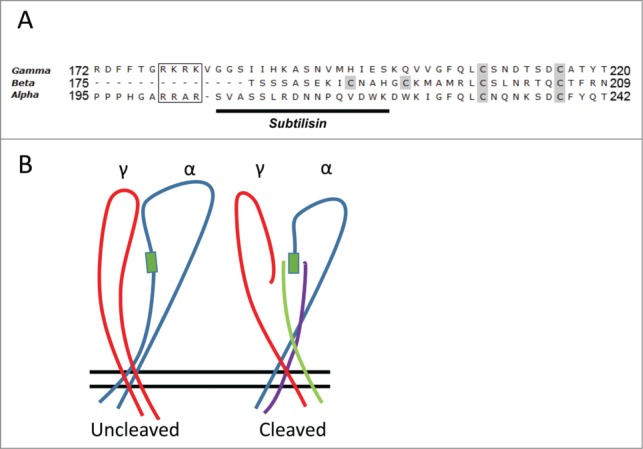
Figure 7.

Endogenous Cysteines and simplified model of interaction. (A) Sequence alignment of the ENaC subunits downstream and including the second cleavage site in α and γ (boxed). Shown in gray are cysteines predicted to be free from homology modeling to the ASIC crystal structure. The 4 free cysteines in α and γ cluster within 35 a.a. of the 2nd cleavage site. The remaining 4 free cysteines in β cluster within the homologous comparable region in this subunit; which lacks cleavage sites. Solid underline shows subtilisin cleavage tract in α. (B) Simplified model depicting extracellular loops of α and γ (β is eliminated for clarity). This model illustrates the interactions in α and γ fragments I and II predicted from the current work. The left image represents pre-cleavage α (blue) and γ (red) while that on the right illustrates how post cleavage γ region II (red), α region II (blue), interact with γ region I (green) and α region I (purple). These interactions occur in the region defined by subtilisin cleavage in α (green box).
