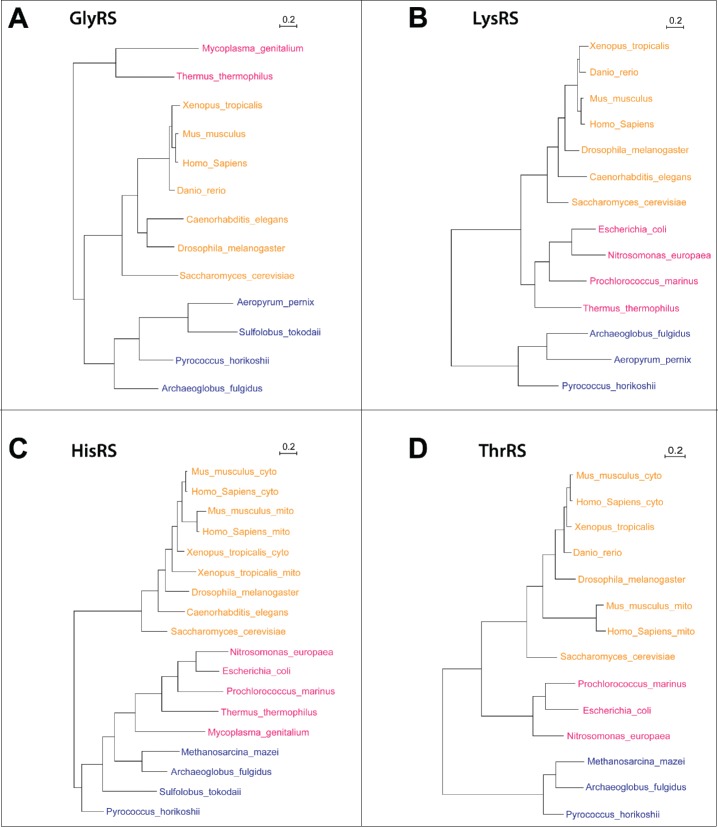
Figure 3.
Phylogenetic analysis of 4 dual-localized aaRSs. Protein sequences of common eukaryotes, archaea, and bacteria were obtained from different databases (UniProt, Ensembl, HGNC, FlyBase, Xenbase, WormBase), and also by searching with BLAST. The sequences were aligned using Pagan,54 followed by TrimAl analysis,55 discarding the poorly aligned columns with the threshold of 60%. The treated multiple sequence alignments were used to generate the 4 gene trees using PhyML56; for topology searches we chose the best out of the NNI and PhyML-Subtree-Pruning-Regrafting (SPR) methods.57,58 All parameters were optimized, i.e., tree topology, branch length and the substitution rate. The number of bootstrap replicates was set to 5. Eukaryotes are shown in yellow, archaea in blue, and bacteria in red. The scale bar stands for the number of substitutions per site.

