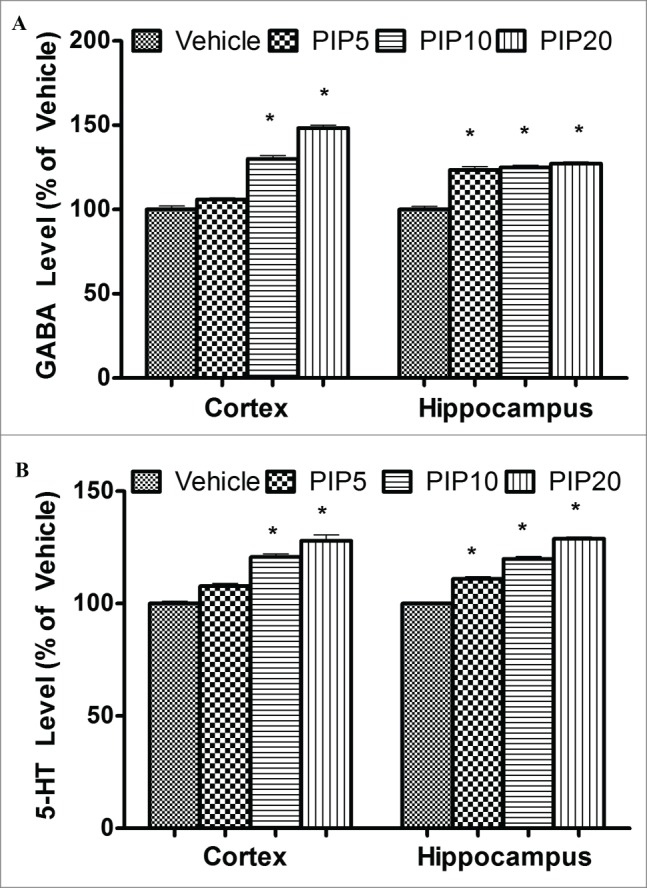
Figure 1.

Effect of piperine on GABA and serotonin levels. (A) The bar chart depicts percentage change in GABA level in cortex and hippocampus and vehicle treated animals at different doses (in mg/kg) of piperine. (B) The bar chart depicts percentage change in serotonin levels in cortex and hippocampus at various doses (in mg/kg) of piperine. Error bars are standard errors, the asterisks denote statistical significance (p < 0.05) relative to vehicle.
