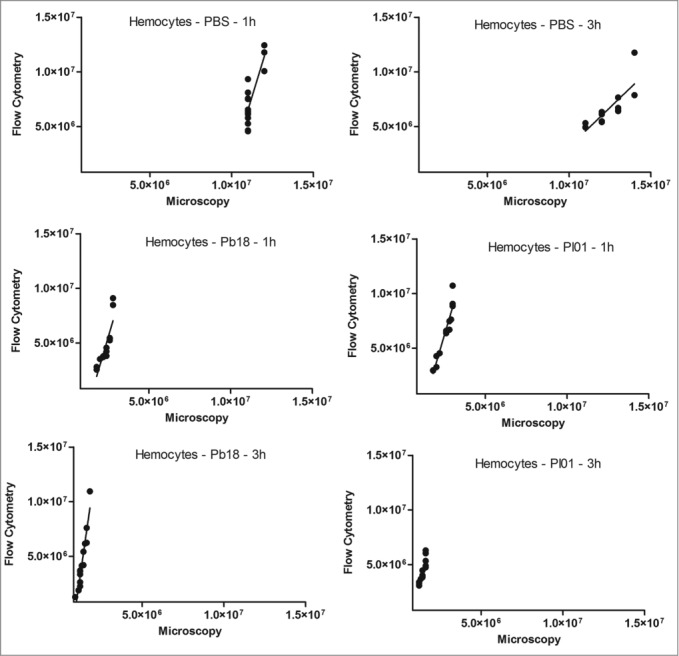
Figure 5.

Linear regression and scatter plots for hemocyte counts (/mL) obtained by flow cytometry and microscopy (manually) in G. mellonella larvae injected with PBS, P. brasiliensis (Pb18 - 5×10⁶ cells/larva) or P. lutzii (Pl01 - 5×10⁶ cells/larva) that were assessed after 1 and 3 h.
