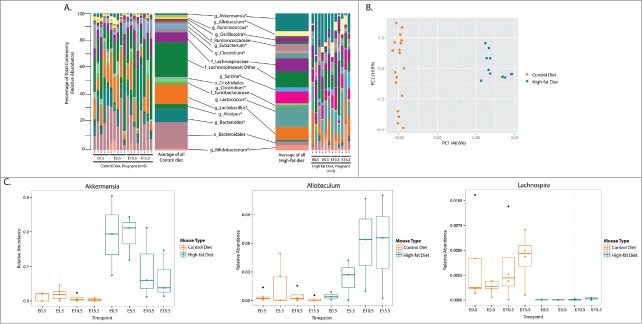
Figure 5.
The maternal gut microbiota during pregnancy is dependent on maternal diet. Pregnant mice in the Con and HF groups are compared to each other. (A) Taxonomic summaries of microbial relative abundance reveal more significant differences in taxa then in any other comparisons made. Each mouse sampled at each timepoint are displayed; the microbial communities of Con and HF pregnant mice are summarized and taxonomic classifications, resolved to the order (o), family (f), or genus (g) level, are displayed and all genera present at a relative abundance of >1.0% are labeled. Asterisks identify genera that were significantly different between Con and HF pregnant mice on this diet; significantly different low abundance genera are listed in Additional File 6. Further, an average taxonomic summary displays the mean relative abundance of each genus per grouping. (B) A Principal Coordinates Analysis (PcoA) using the Bray Curtis distance metric displays distinct separation of pregnant animals on differing diets, and distinct clustering of mice from each diet type (PERMANOVA, P = 0.001). (C) The relative abundances of 3 genera identified as significantly different between Con-fed and HF-fed pregnant animals are visualized. The x-axis indicates the sampling timepoints and samples are colored by pregnancy information. All other significant genera are displayed in Figure S3.

