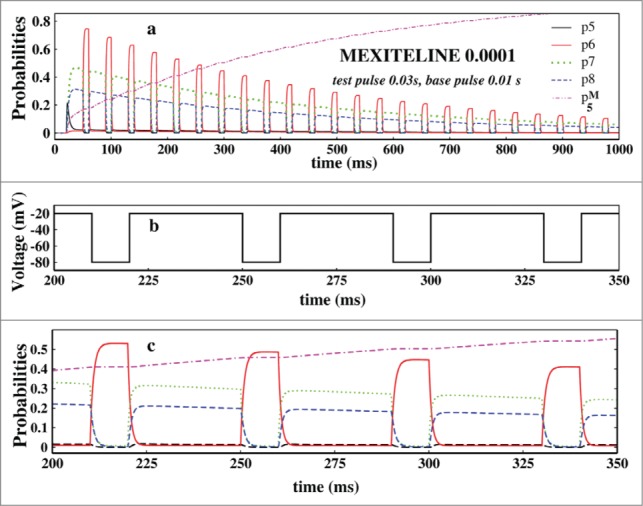
Figure 8.

Study of probabilities. In (A), the open state probability and the 3 inactive state probabilities and the drug binding state probabilities have been plotted in presence of 0.0001 M mexilitine concentration and in presence of pulses mentioned. In (B), the 4 test pulses of (A) which have been studied is shown here. In (C), the aforesaid probabilities are plotted for the above 4 pulses.
