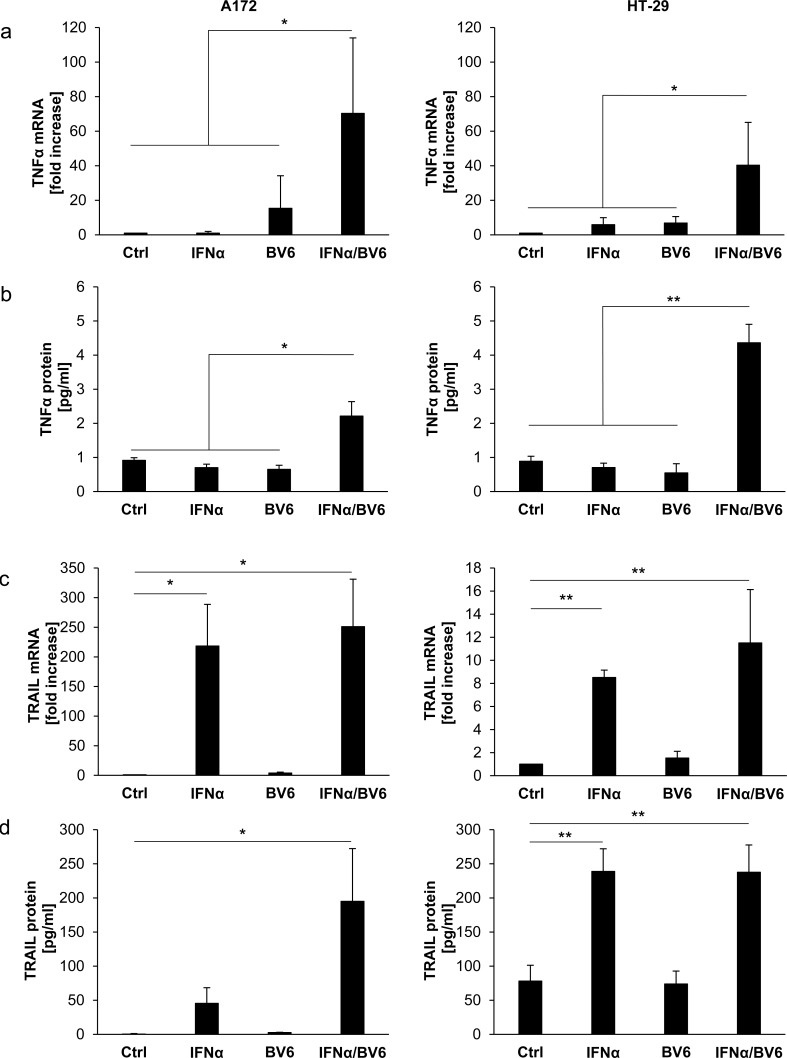
Figure 5. IFNα and BV6 cooperate to increase TNFα and TRAIL production.
A. Cells were treated for 12 hours with IFNα (A172: 5 ng/ml, HT-29: 10 ng/ml) and/or 1 μM BV6. TNFα mRNA levels were determined by qRT-PCR and are shown as fold increase with mean + SD of four independent experiments performed in duplicate; 28S rRNA was used as loading control, *P < 0.05; **P < 0.01. B. Cells were treated for 14 hours with IFNα (A172: 5 ng/ml, HT-29: 10 ng/ml) and/or 1 μM BV6. TNFα protein levels in cell culture supernatants were determined by ELISA and are shown as protein concentration with mean + SD of four independent experiments performed in duplicate; *P < 0.05; **P < 0.01. C. Cells were treated for 12 hours with IFNα (A172: 5 ng/ml, HT-29: 10 ng/ml) and/or 1 μM BV6. TRAIL mRNA levels were determined by qRT-PCR and are shown as fold increase with mean + SD of three (A172) or four (HT-29) independent experiments performed in duplicate; 28S rRNA was used as loading control, *P < 0.05; **P < 0.01. D. Cells were treated for 16 hours with IFNα (A172: 5 ng/ml, HT-29: 10 ng/ml) and/or 1 μM BV6. TRAIL protein levels from cell lysates were determined by ELISA and are shown as protein concentration with mean + SD of four independent experiments performed in duplicate; *P < 0.05; **P < 0.01.

