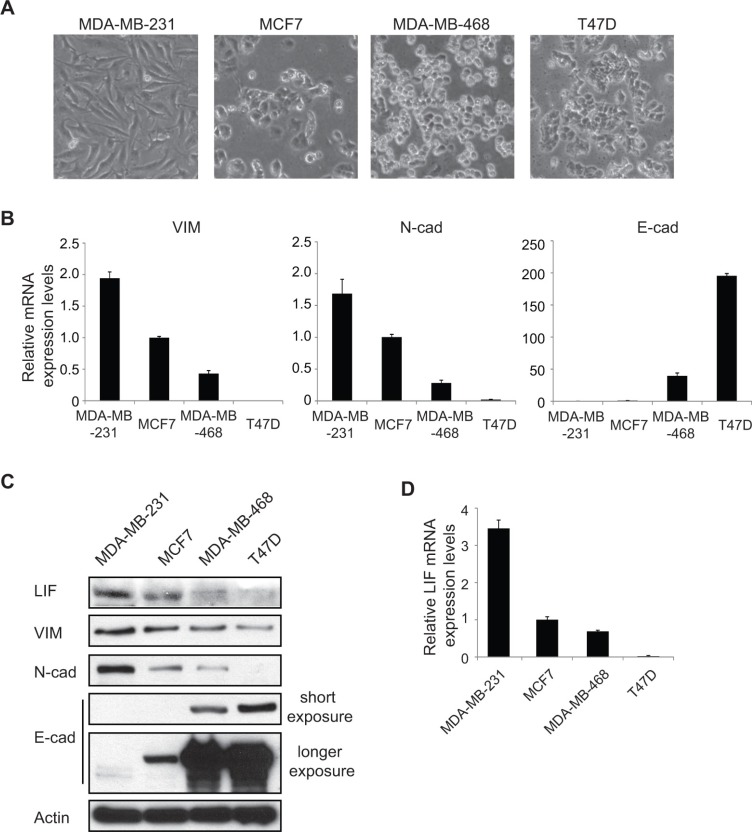
Figure 1. LIF expression levels are associated with the levels of EMT markers in human breast cancer cell lines.
(A) The phase-contrast photomicrographs display the morphology of a group of human breast cancer cell lines (MDA-MB-231, MCF7, MDA-MB-468 and T47D). (B) The mRNA expression levels of mesenchymal markers Vimentin (VIM), N-cadherin (N-cad) and epithelial marker E-cadherin (E-cad) were determined in above mentioned breast cancer cell lines by real-time PCR. The mRNA levels of these genes were normalized to β-actin. (C) The protein levels of mesenchymal markers (VIM, N-cad) and epithelial marker (E-cad) were measured in cells by Western blot assays with short and longer exposure, respectively. (D) The mRNA levels of LIF were determined in cells by real-time PCR. In B and D, data are presented as mean ± s.d. (n = 3).

