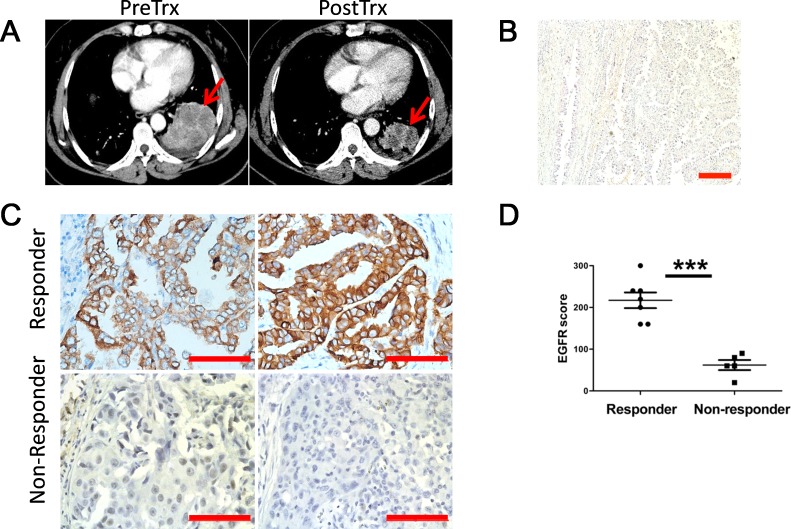
Figure 1. Lung cancer patients overexpressing wt-EGFR respond to TKI treatment.
A. Representative CT images for responders before and after Gefitinib treatment. Tumor is highlighted with read arrows. PreRx for before treatment; PostRx for after treatment. B. H&E examination revealed poorly differentiated lung adenocarcinoma pathological type in responders. C. IHC staining of representative responders and non-responders for EGFR expression level (scale bars, 200μm). D. Statistics of EGFR expression level comparison between responders and non-responders. Statistics was done on randomly picked 6 responders and 6 non-responders.

