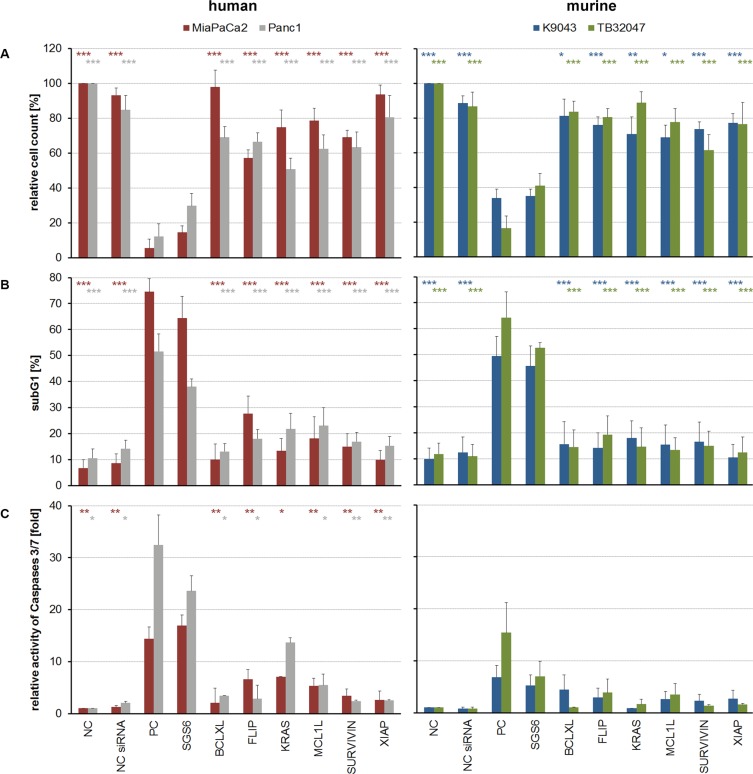
Figure 3. Cellular effects caused by single and combined target inhibition with low-concentrated siRNA.
(A) Adherent cells were counted in relation to their negative control (NC). (B) For evaluation of apoptosis induction subG1 fractions were determined by cell cycle analysis and (C) Caspase assays were performed. An unpaired Student's t-test was used to calculate the differences of the NCs or single-targeted cells in relation to the SGS6 samples (n ≥ 3; *p ≤ 0,05, **p ≤ 0,01, ***p ≤ 0,001).

