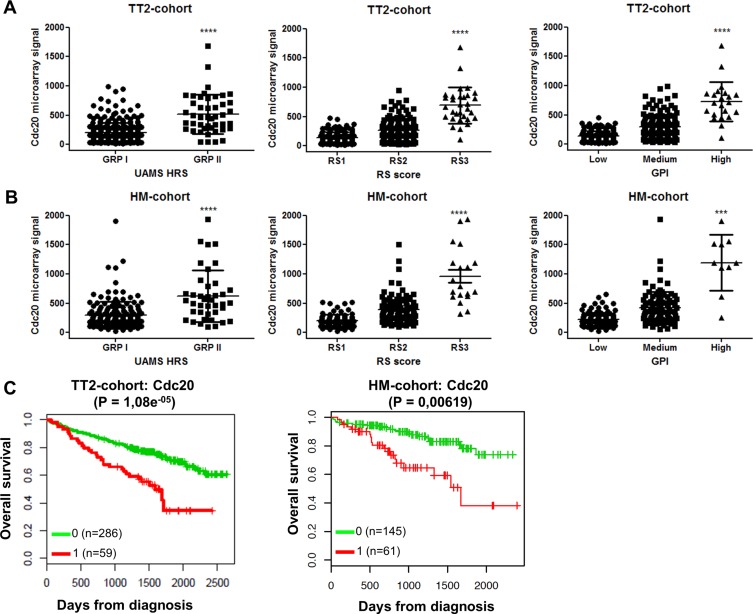
Figure 1. Cdc20 expression levels and prognostic value in MM patients.
(A–B) Association of Cdc20 expression levels in MM patients with gene expression-based high-risk scores in TT2-cohort and HM-cohort. The high-risk groups are compared to the overall mean expression in all groups. ***indicates p-value is < 0.001 and ****p-value is < 0.0001 (student t-test). (C) The overall survival in the TT2-cohort and HM-cohort for low (green) or high (red) Cdc20 expression in MM patients.

