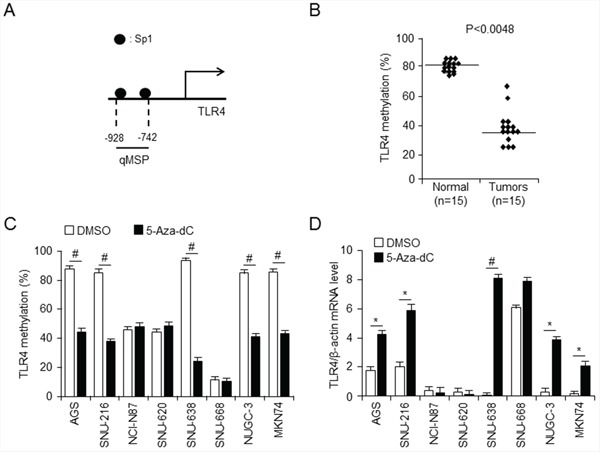
Figure 2. Analysis of relationship between TLR4 expression and promoter methylation in gastric cancer.

A. Schematic diagram of TLR4 promoter, showing positions of Sp1 binding sites. quantitative methylation-specific PCR (qMSP) were analyzied for methylation pattern of CpG sites on TLR4 promoter in normal and gastric cancer tissues (p < 0.0048) B. and the indicated gastric cancer cell lines C. treated with 5-aza-dC or DMSO (control) (#p < 0.001). The TLR4 promoter was methylated at a much higher level in low level of TLR4 mRNA expressing gastric cancer cell line SNU638, but not in SNU668. D. qPCR analysis effect of 5-aza-dC on TLR4 expression in the indicated gastric cancer cells. * p < 0.05, # p < 0.01. Low level of TLR4 mRNA expressing SNU638 gastric cancer cells was demethylated by 5-aza-dC.
