
Figure 1. Spectrum of mutations in AKT1, AKT2, and AKT3.
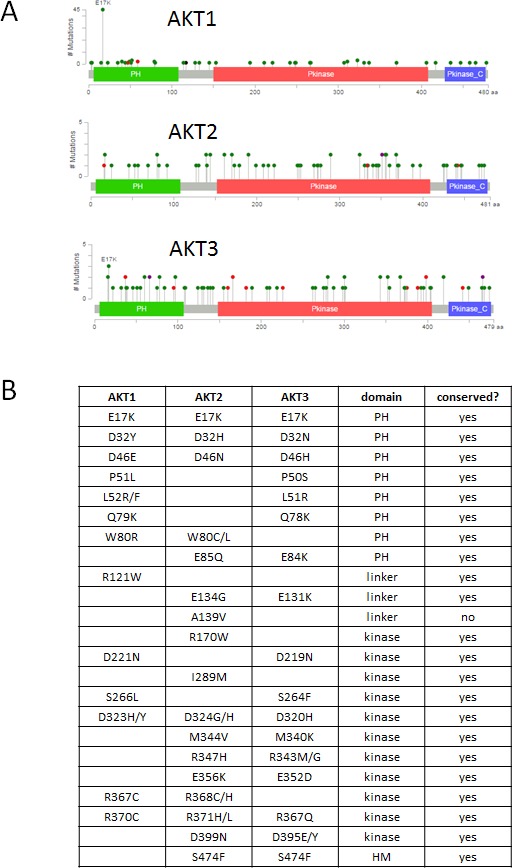
A. Figure and data derived from cBioPortal website [3]. Pleckstrin homology (PH), kinase, and C-terminal regulatory domains are depicted. Mutations are color coded by type: missense (green), nonsense (red). B. Recurrent mutations across AKT isoforms analyzed in this study. PH, pleckstrin homology. HM, hydrophobic motif.