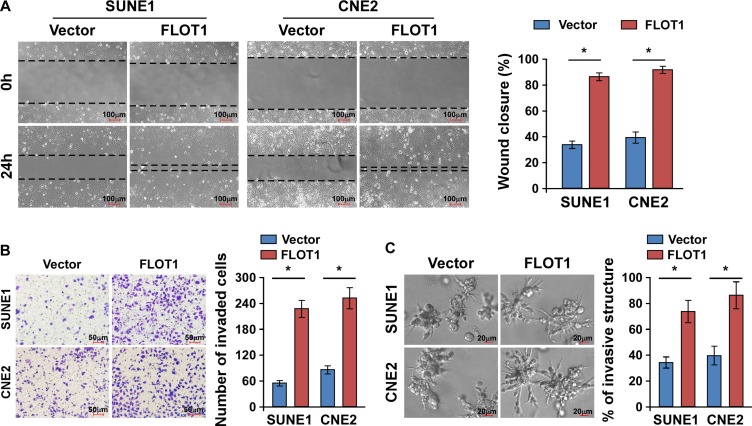
Figure 2. FLOT1 enhances the migration and invasion of NPC cells.
(A) Representative micrographs and quantification of the motility of FLOT1-overexpressing NPC cells in the wound healing assay at 0 h and 24 h compared to vector control cells. Scale bars: 100 μm. (B) Representative micrographs and quantification of the invasiveness of FLOT1-overexpressing cells in the transwell matrix invasion assay compared to vector control cells. Scale bars: 50 μm. (C) Representative micrographs (left) and quantification of invasive structures (right) of FLOT1-transduced and vector-transduced SUNE1 and CNE2 cells cultured in the 3–D spheroid invasion assay. Scale bars: 20 μm. Error bars represent mean ± SD from three independent experiments, *P < 0.05.

