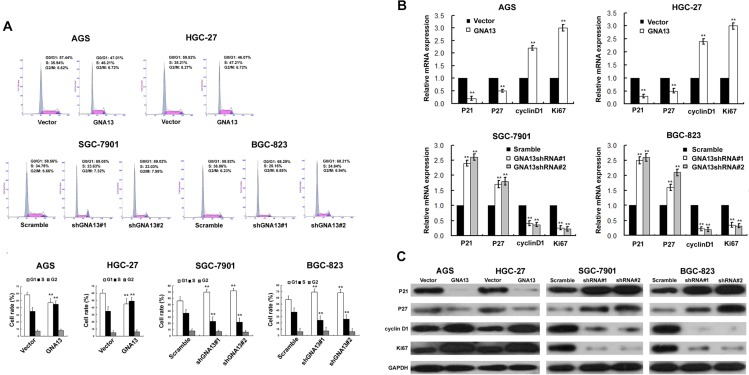
Figure 5. The effect of GNA13 on cell cycle of distribution and G1–S-phase regulators of GC cells.
(A) Upper: representative histograms depicting cell cycle profiles of indicated cells. Cells were stained with PI and analyzed by flow cytometry. Lower: proportion of cells in various phases of the cell cycle. (B) Real-time PCR analysis of p21Cip1, p27Kip1, Ki67, and cyclinD1 mRNA expression in GNA13-transduced cells (upper panel) or GNA13 shRNA–infected cells (lower panel). Expression levels were normalized to GAPDH. (C) Western blot analysis of p21Cip1, p27Kip1, cyclin D1, and Ki67 proteins in GNA13-transduced cells or GNA13 shRNA–infected cells. GAPDH was used as a loading control. *P < 0.05; **P < 0.01.

