
Figure 3. Template-based docking of 2.12 into the active site of SHMTs.
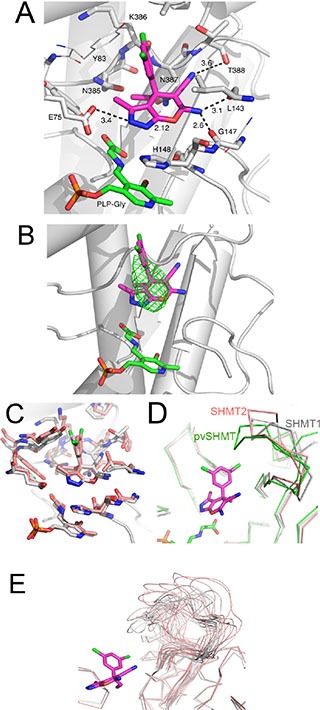
(A) Docked 2.12 to human SHMT1, 2.12 and PLP-Glycine complex are depicted as purple and green sticks, respectively. Protein-ligand polar interactions are shown as black dashes, distances are given in Å. Residue numbering refers to SHMT1. (B) Docked 2.12 superposed with the low-resolution (4.2 Å) difference electron density map (contour level at 3.0 sigma) of SHMT1 co-crystallized with 2.12. The difference electron density map is shown as green mesh. (C) Comparison of 2.12 docked to SHMT1 (white) and pvSHMT (pink). Atom coloring is the following: N blue, O red, P orange. The backbone of SHMT1 is also shown, as reference. (D) Comparison of the loop region (residues 386-399) of human SHMT1 (white), Plasmodium vivax SHMT (green) and human SHMT2 (mitochondrial, pink). Only Cα traces are shown. 2.12 is also shown, as pink sticks. (E) Loop conformations sampled during a 100 ns molecular dynamics simulation of apo human SHMT1 (white) and SHMT2 (pink).