
Figure 7. Effect of selected metabolites on cells 2.12-treated and selectivity of 2.12 against SHMT1.
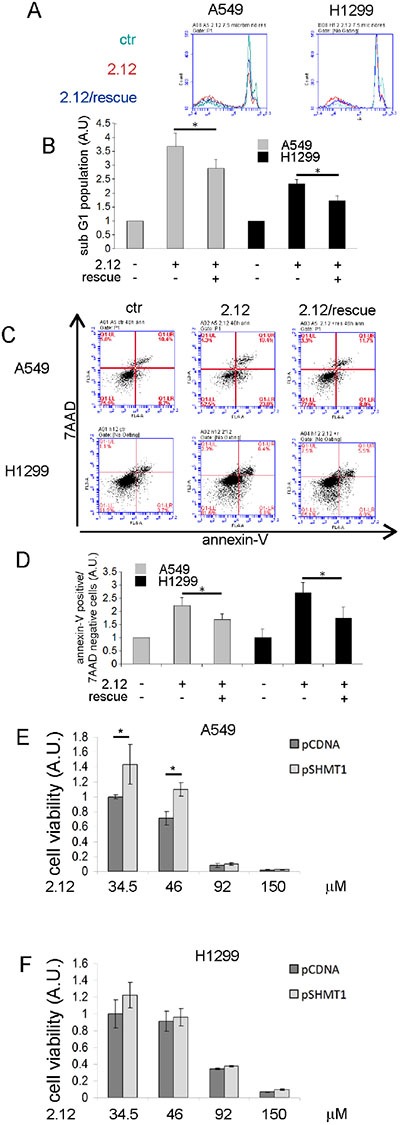
Apoptotic rate evaluation of A549 and H1299 treated or not with 2.12 and grown in minimal essential medium supplemented or not with serine, glycine and 5-formyl-THF. (A) and (B) PI staining, (C) and (D) AnnexinV/7-ADD staining. (E) and (F) XTT assay on A549 and H1299 respectively transfected with the indicated plasmid and treated or not with 2.12 34 μM for 48 hours. Data in B, D, E and F represent mean ± standard deviation of at least 3 independent experiments. * = P ≤ 0.05.