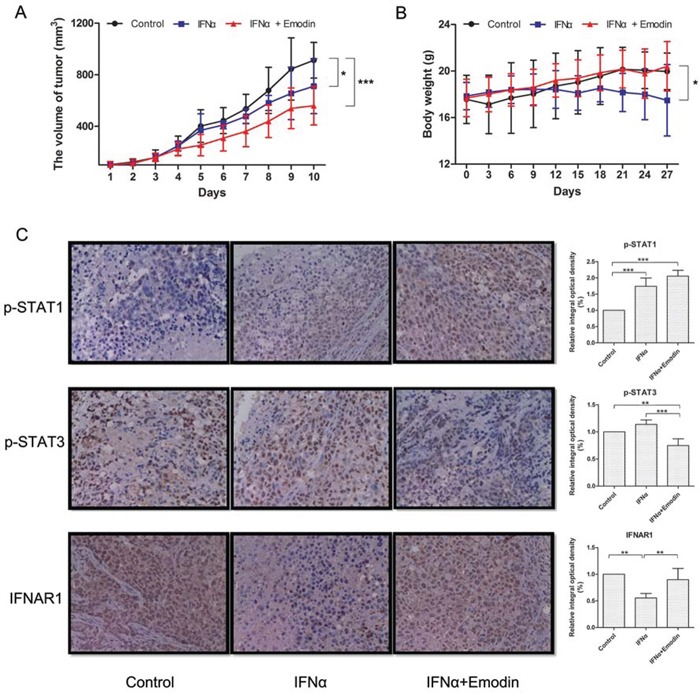
Figure 8. Emodin promotes the antiproliferative effect of IFN-α in vivo.

Huh-7 cells (5 × 10⁶ cells/mice) were injected subcutaneously into the right flank of the mice. The animals were randomly divided into three groups based on tumor volume (about 100 mm3). Group I was treated with vehicle, group II was treated with IFN-α and group III was treated with a combination of IFN-α and emodin. Tumor volume (A) and body weight (B) were measured at 3-day intervals. (*) p < 0.05, (**) p < 0.01, (***) p < 0.001 vs. control or IFN-α (n = 6). (C) The expressions of p-STAT1, p-STAT3, and IFNAR1 in tumor tissues were measured by immunohistochemistry. Typical images were obtained by Nikon Ti-E microscope (× 400). The relative integral optical density was normalized to control. (**) p < 0.01, (***) p < 0.001 vs. control or IFN-α (n = 6).
