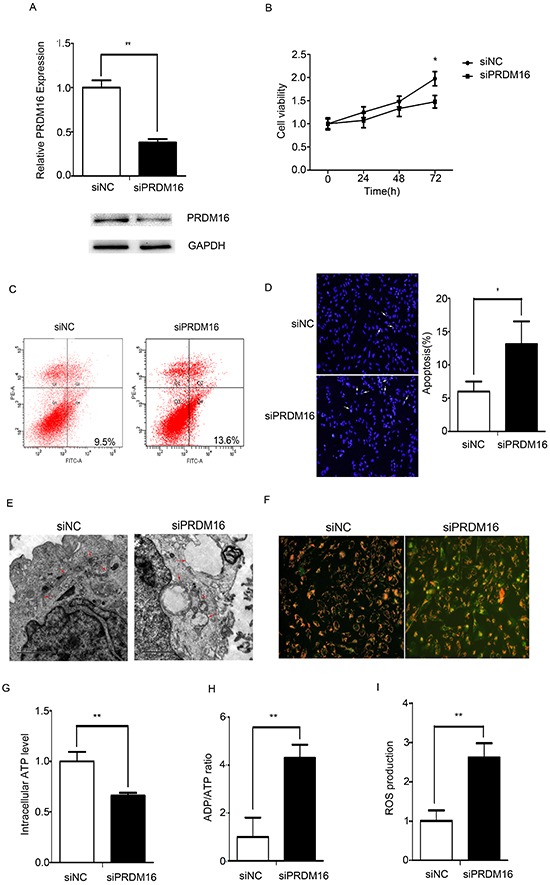
Figure 2. PRDM16 knockdown disrupted mitochondrial function in U251 cells.

A. Real-time PCR and western blot analyses were used to detect expression of endogenous PRDM16 after transfection with siRNA or control RNA. B. A cell growth assay was used to analyze the effects of PRDM16 siRNA on the proliferation of U251 cells. C and D. Flow cytometry and DAPI staining were performed to detect the effct of PRDM16 siRNA on cells apoptosis of U251 cells. E. Transmission electron micrograph was used to observe the effect o f PRDM16 siRNA on U251 cells morphologies. F. JC-1 staining analysis was used to detect mitochondrial membrane potentials after transfection with PRDM16 siRNA or control RNA. Red fluorescence indicates normal U251 cells, and green fluorescence indicates cells with mitochondrial dysfunction. G, H. and I. Mitochondrial ATP levels, ADP/ATP ratios and ROS production levels were detected 48 h after transfection with PRDM16 siRNA or control RNA.
