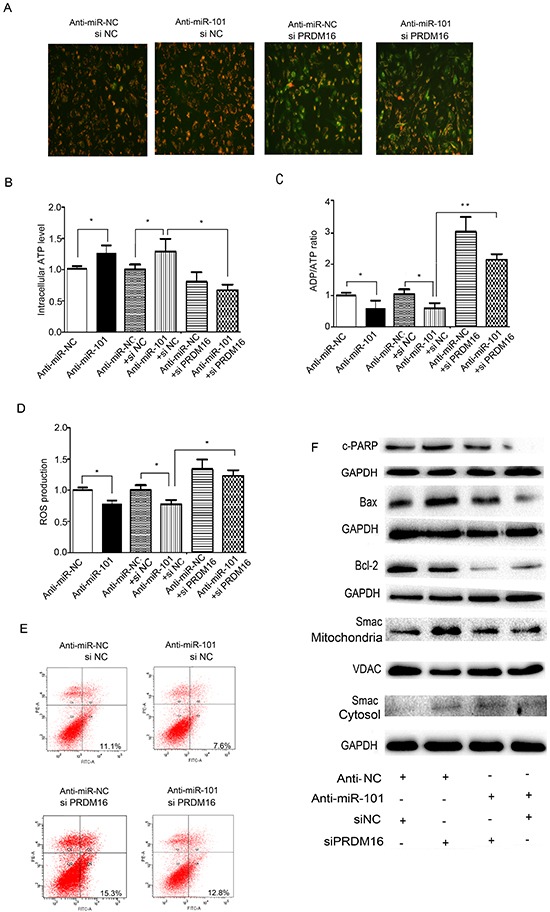
Figure 6. PRDM16 knockdown reversed the anti-apoptotic effect of miR-101.

A. Mitochondrial membrane potentials were monitored by using JC-1 staining. U251 cells were transfected with anti-miR-NC or siNC, anti-miR-101 or siNC, anti-miR-NC or siPRDM16, and anti-miR-101 or siPRDM16, respectively. Red fluorescence indicates normal U251 cells, and green fluorescence indicates cells with mitochondrial dysfunction. B, C and D. Mitochondrial ATP levels, ADP/ATP ratios and ROS production levels were detected 48 h after transfection with anti-miR-NC, anti-miR-101, anti-miR-NC or siNC, anti-miR-101 or siNC, anti-miR-NC or siPRDM16, and anti-miR-101 or siPRDM16, respectively. E. Flow cytometry analysis was performed 48 h after transfection of U251 cells with anti-miR-NC or siNC, anti-miR-101 or siNC, anti-miR-NC or siPRDM16, and anti-miR-101 or siPRDM16, respectively. F. Western blot analysis of Bax, Bcl-2 and Smac expression levels after transfection with anti-miR-NC or siNC, anti-miR-101 or siNC, anti-miR-NC or siPRDM16, and anti-miR-101 or siPRDM16, respectively. GAPDH and VDAC were used as loading controls for cytoplasmic protein and mitochondrial protein levels, respectively.
