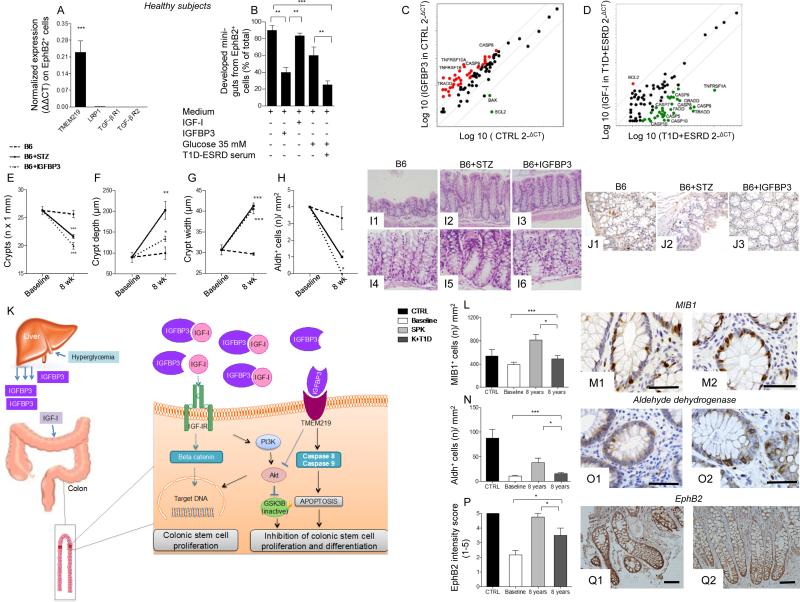
Figure 4. Effects of the peripheral IGF-I/IGFBP3 dyad on single-cell derived in vitro mini-guts and on caspase cascade. Manipulating the peripheral IGF-I/IGFBP3 dyad alters the progression of diabetic enteropathy in a preclinical model of diabetic enteropathy, while the treatment of long-standing T1D with simultaneous pancreas-kidney transplantation (SPK) ameliorates intestinal symptoms, motility and morphology.
A. Bar graph representing normalized mRNA expression of TMEM219, LRP1, TGF-β type I and II, in EphB2+ sorted single cells obtained from crypts of healthy subjects. Experiments were performed in triplicate. B. Bar graphs showing % of developed single cell-derived mini-guts (of the total) obtained from EphB2+ cells sorted from freshly isolated crypts of healthy subjects and cultured in different conditions (normal glucose+normal serum, high glucose+normal serum, T1D+ESRD serum+normal glucose, T1D+ESRD serum+high glucose) and showing the effect of IGF-I and IGFBP3. The p values are relative to baseline conditions. C, D. Scatter plot representing the apoptosis transcriptome profiling examined in freshly isolated intestinal crypts of healthy subjects (CTRL) and long-standing T1D individuals (T1D+ESRD) cultured with/without IGFBP3 and IGF-I. Experiments were performed in triplicate. E, F, G. Line graphs reporting the number of crypts (E), depth of crypts (F) and width of crypts (G) assessed on intestinal lower tract sections harvested at baseline and after 8 weeks from STZ-treated B6 mice developing diabetic enteropathy (B6+STZ), naïve B6 (B6), and naïve B6 treated with IGFBP3 (B6+IGFBP3). STZ: streptozoticin-treated. n=3 mice per group were evaluated. H. Bar graph representing the number of Aldh+ cells/mm2 in immunostained sections of STZ-treated B6 mice developing diabetic enteropathy, B6, and naïve B6 treated with IGFBP3 (B6+IGFBP3). I1-I6.Representative images of intestinal crypts on H&E sections of B6, B6+STZ mice developing diabetic enteropathy, and naïve B6 treated with IGFBP3 (B6+IGFBP3). Histology magnification, 200X I1-I3, 400X I4-I6. J1-J3. Representative images of Aldh+ cells on immunostained sections of intestinal lower tract harvested from STZ-treated B6 mice developing diabetic enteropathy, B6, and naïve B6 treated with IGFBP3 (B6+IGFBP3). Histology magnification, 400X. K. Schematic attempt to represent the effect of circulating IGF-I and IGFBP3 on CoSCs. L, N, P.Bar graphs report the measurement of MIB1+ and Aldh+ cells, and EphB2+ expression (intensity score 0-5) in the four groups of subjects (n=20 CTRL, n=30 SPK, n=K+T1D and n=60 T1D+ESRD). M1-M2, O1-O2, Q1-Q2. Representative images of MIB1+ and Aldh+ cells, and EphB2+ expression in immunostained rectal mucosa bioptic samples of T1D+ESRD who underwent kidney alone (K+T1D) or simultaneous pancreas-kidney (SPK) transplantation at 8 years of follow-up. Histology magnification, 400X in M1-M2 and O1-O2, 20X in Q1-Q2. Scale bar 80 micron. Data are expressed as mean ± standard error of the mean (SEM) unless differently reported. *p<0.01; **p<0.001; ***p<0.0001. See also Figure S3, S4 and S5.
Abbreviations: STZ, streptozoticin-treated; B6, C57BL/6J mice; IGF-I, insulin-like growth factor 1; IGFBP3, insulin-like growth factor binding protein 3; IGF-IR, insulin-like growth factor 1 receptor; CoSC, colonic stem cell; T1D, type 1 diabetes; ESRD, end stage renal disease; CTRL, healthy subjects; SPK, simultaneous kidney-pancreas transplantation; K+T1D, kidney transplantation alone in type 1 diabetes; H&E, hematoxylin and eosin; MIB1, antibody against Ki67; EphB2, Ephrin B receptor 2; Aldh, Aldehyde dehydrogenase; SEM, standard error of the mean.

