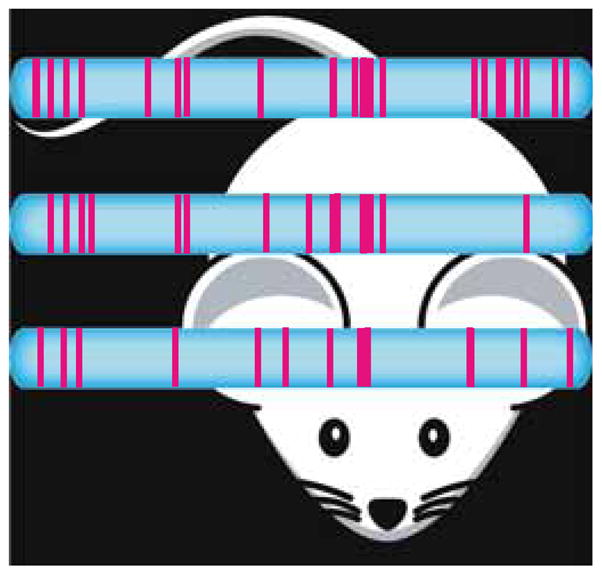
Figure 2.

Differences and commonalities in the distribution of genes (pink) that escape X inactivation on the mouse X chromosome (centromere to the left) between tissues in vivo: ovary (top), spleen (middle), and brain (bottom). Pink bars indicate the position of escape genes on schematics of the mouse X chromosome (centromere at left) (see Berletch et al. 2015).
