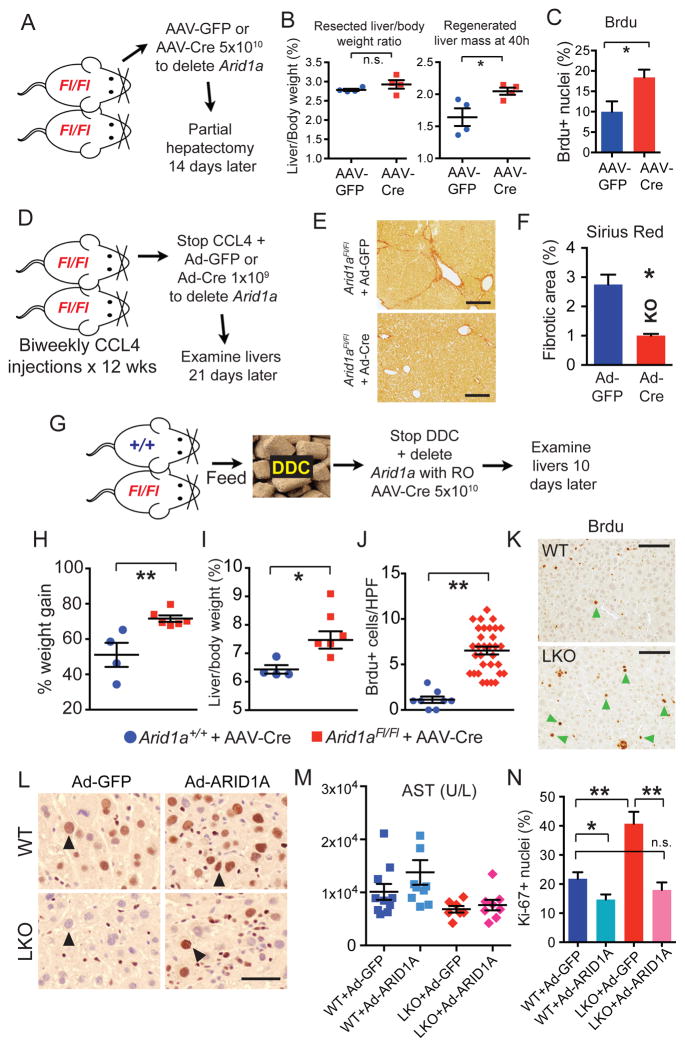
Figure 3. Conditional deletion of Arid1a leads to improved liver regeneration after surgical and chemical injuries.
(A) Schema for conditional knockout experiment prior to partial hepatectomy. Arid1aFl/Fl mice were randomized to AAV-GFP or AAV-Cre to delete Arid1a in liver tissues. Fourteen days later, partial hepatectomy was performed.
(B) Resected liver/body weight ratio and regenerated liver mass 40 hours after hepatectomy (n = 4 and 4).
(C) Hepatocyte proliferation as measured by Brdu.
(D) Schema for post-CCL4 injury conditional knockout experiment. Arid1aFl/Fl mice were injected with biweekly CCL4 for 12 weeks, then CCL4 was stopped and mice were randomized to either 1 × 10⁹ PFU of Adenovirus-GFP or Adenovirus-Cre to delete Arid1a in liver tissues.
(E) Livers were examined for fibrosis using Sirius Red after 20 days (n = 3 Ad-GFP and 5 Ad-Cre treated females, Scale bar = 200μm).
(F) Quantification of Sirius Red staining area (8 images for each mice were averaged, n = 3 and 5 mice were analyzed).
(G) Schema for post-DDC injury conditional knockout experiment. Arid1a+/+ and Arid1aFl/Fl mice were fed with 4 weeks of DDC food. Once severe injury was achieved, DDC was stopped and all mice were injected with 5 × 10¹⁰ particles of AAV-Cre to conditionally delete Arid1a in hepatocytes. Mice were allowed to recover for 10 days, then livers were examined (in all following experiments, n = 4 Arid1a+/+ and 6 Arid1aFl/Fl males).
(H) % of original body weight gained over 10 day recovery period.
(I) Liver/body weight ratio (%) after 10 day recovery period.
(J) Hepatocyte proliferation as measured by BrdU positive cells per High-Power Field (HPF) after 10-day recovery period.
(K) BrdU immunostaining (Scale bar = 100μm). Green arrowheads point to BrdU positive hepatocytes, other spots are non-specific.
(L) WT and Arid1a LKO mice were injected with Adenovirus carrying either GFP (Ad-GFP) or ARID1A (Ad-ARID1A) under the control of a CMV promoter. IHC detecting both human ARID1A and mouse Arid1a shown here (Black arrowheads point to hepatocyte nuclei, Scale bar = 25μm).
(M) Serum AST measured 24 hours after one dose of CCL4 (n = 10, 9, 7, 8 mice).
(N) Proliferation per HPF as quantified by Ki-67 in liver sections 48 hours after CCL4 (5 HPFs averaged per mouse, n = 5 mice for each condition).
All data in this figure are represented as mean +/− SEM, * P<0.05, ** P< 0.01. “n” refers to biological replicates. All experiments were performed in triplicates. See also Figures S3.

