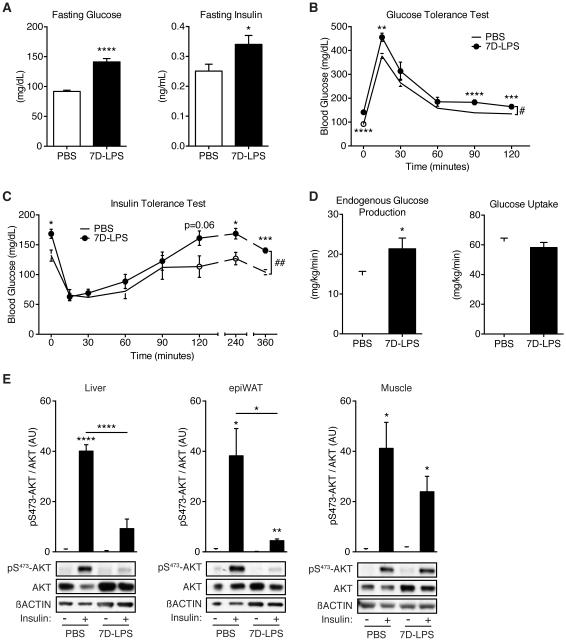
Figure 1. Sustained inflammation induces fasting hyperglycemia.
(A) Fasting plasma glucose and insulin levels in mice given LPS for 7 days (7D-LPS) or mice receiving PBS as control (n=10/condition).
(B) Glucose tolerance test (GTT) in PBS or 7D-LPS treated mice (n=10/condition).
(C) Insulin tolerance test (ITT) in PBS or 7D-LPS treated mice (n=5/condition).
(D) Hyperinsulinemic-euglycemic clamp was performed on PBS or 7D-LPS treated mice and endogenous glucose production and glucose uptake were measured (n=4-7/condition).
(E) Insulin stimulated phosphorylated-AKT on serine 473 (pS473-AKT) was evaluated in tissues from overnight fasted PBS or 7D-LPS mice. Bar plots represent densitometry analysis of pS473-AKT/AKT (n=3-4/condition). Data is presented as mean ± SEM. * p < 0.05, ** p < 0.01, *** p < 0.001, **** p < 0.0001 by Student’s T-Test. # p < 0.05, ## p < 0.01 by two-way analysis of variance (2-ANOVA). See also Figure S1.

