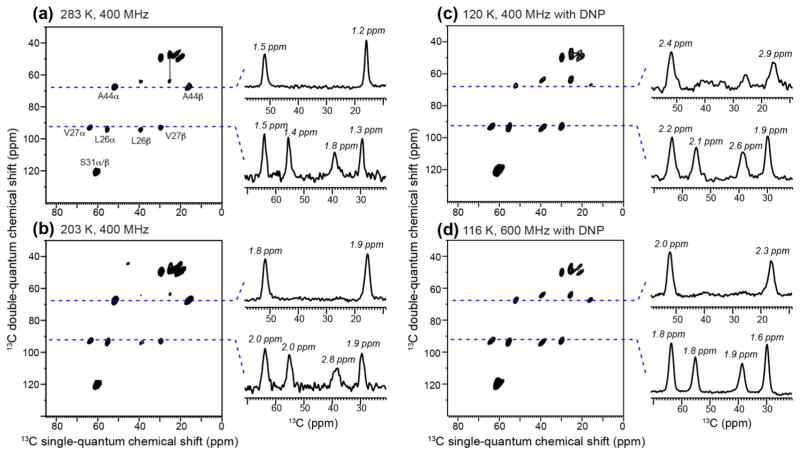
Figure 3.
2D 13C-13C dipolar INADEQUATE spectra of D44A-M2TM in DMPC bilayers. (a) Spectrum measured at 283 K on a 400 MHz spectrometer. (b) Spectrum measured at 203 K on a 400 MHz spectrometer. (c) Spectrum measured at 120 K using DNP on a 400 MHz spectrometer. (d) Spectrum measured at 116 K using DNP on a 600 MHz spectrometer. The sample for (a–b) does not contain cryoprotectant or radicals and used protonated DMPC. The sample for (c–d) used glycerol-protected d54-DMPC and 10 mM AMUPol (sample 1). The lowest contour level for all 2D spectra is at 15% of the highest intensity of each spectrum, and 24 contour levels are shown. Representative 1D cross sections are extracted to compare 13C linewidths. The non-methyl 13C signals broadened by 0.1–0.4 ppm from the 283 K 400 MHz spectrum to the 116 K 600 MHz DNP spectrum.

