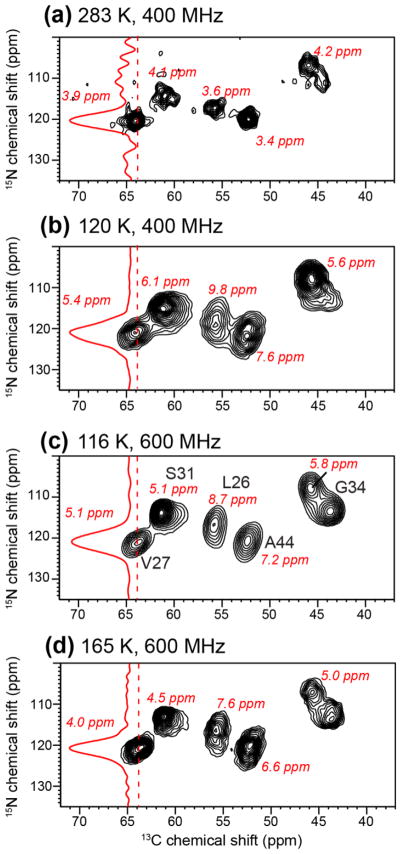
Figure 4.
2D 15N-13C correlation spectra of membrane-bound M2TM under different conditions to examine 15N spectral resolution. (a) Spectrum of DMPC-bound M2TM at 283 K without DNP on a 400 MHz spectrometer. (b) Spectrum of DLPE-bound M2TM at 120 K measured on a 400 MHz DNP spectrometer (sample 9). (c) Spectrum of d54-DMPC bound M2TM at 116 K measured on a 600 MHz DNP spectrometer (sample 1). (d) Spectrum of d54-DMPC bound M2TM at 165 K measured on a 600 MHz DNP spectrometer. The samples for (b–d) are cryoprotected with glycerol containing 10 mM AMUPol. All spectra were plotted with the lowest contour at 20% of the highest peak in each spectrum and 16 contour levels are plotted.

