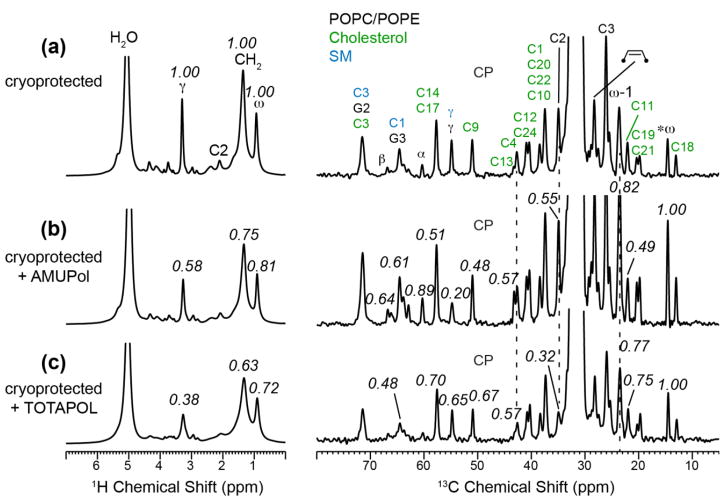
Figure 6.
Radical-induced PRE of glycerol-protected VM+ membranes. Left column: 1H spectra. Right column: 13C CP-MAS spectra. (a) Without radical. (b) With 10 mM AMUPol. (c) With 10 mM TOTAPOL. Peak assignments are given in (a) for phospholipids (black), SM (blue), and cholesterol (green). The 1H S/S0 values are with respect to the control spectrum (a), while the 13C S/S0 values are further normalized with respect to the ω peak.

