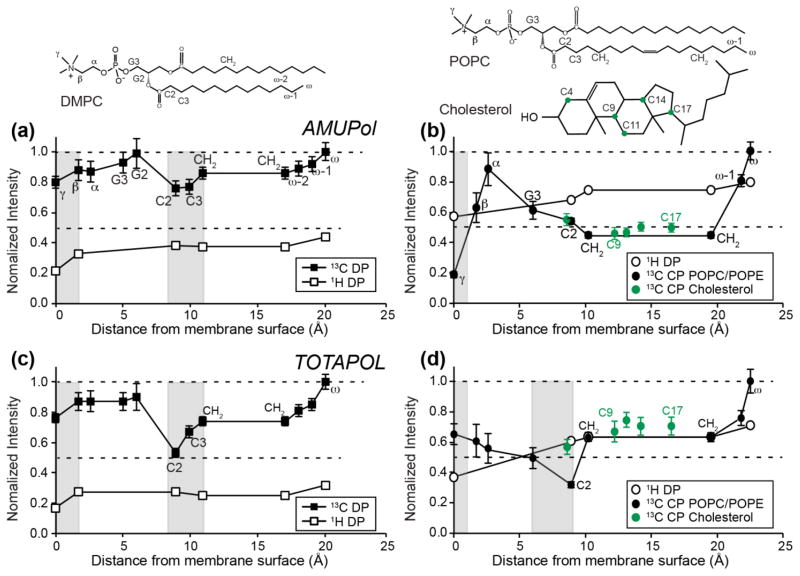
Figure 7.
Residual intensities, S/S0, of radical-containing membranes. (a, c) DMPC membrane. (b, d) VM+ membrane. (a, b) 1H and 13C S/S0 values of membranes containing 10 mM AMUPol. (c, d) 1H and 13C S/S0 values of membranes containing 10 mM TOTAPOL. The x-axis shows the depths of lipid and cholesterol functional groups (Craven, 1976; Kucerka et al., 2005; Nagle and Tristram-Nagle, 2000), with the chemical structures of lipids and cholesterol drawn to scale along the x-axis. Shaded vertical bars indicate the positions of local S/S0 minima, which indicate the most likely radical positions. The error bars of 1H data points are less than 2%, thus are not plotted here.

