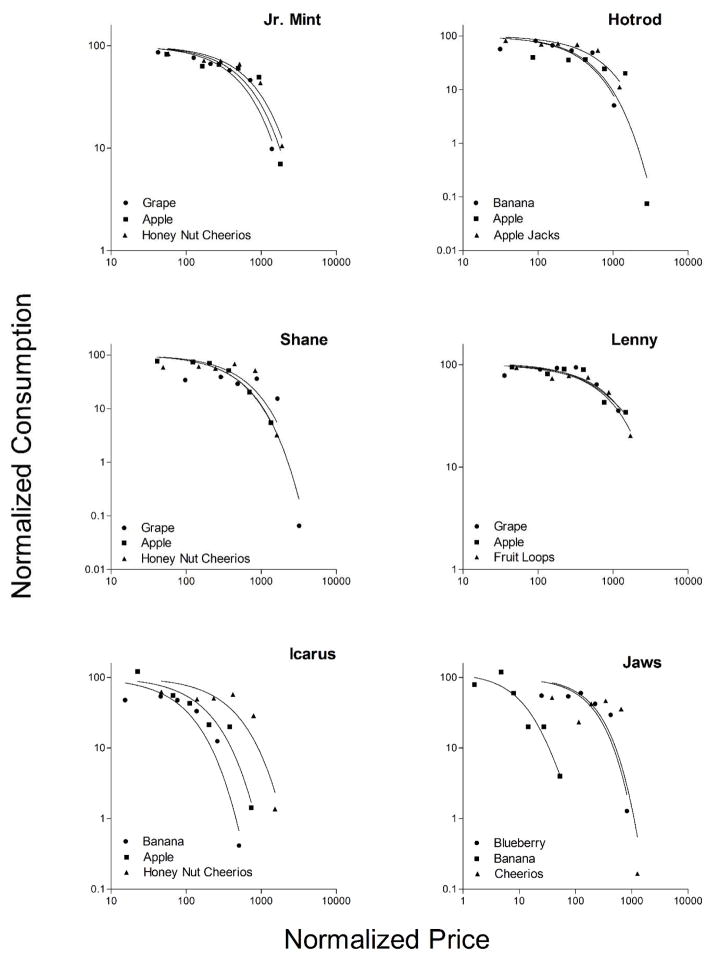
Figure 2.
Normalized number of food pieces consumed by each subject as a function of the normalized weight in g that had to be lifted to produce a piece of food. See text for explanation of the normalization method. Equation 1 is fitted to the data in each panel. All food types are presented in each panel so that the different demand curves for each food type may be compared visually. Both axes are logarithmically scaled

