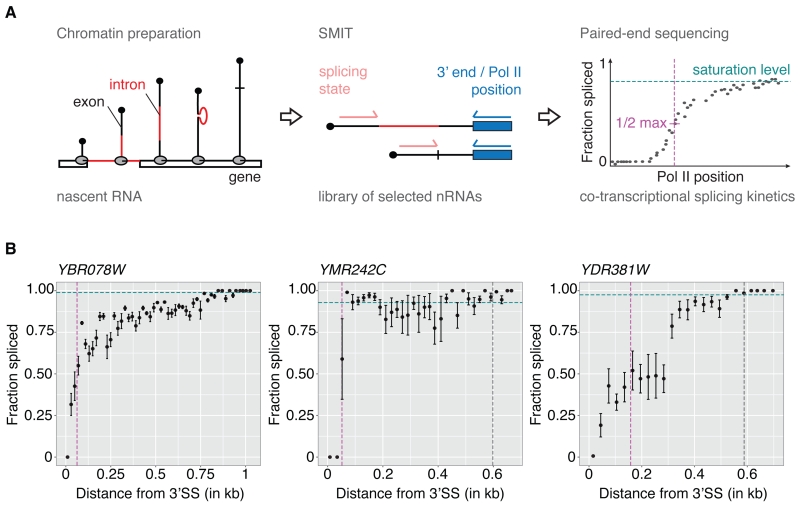
Figure 1. Single molecule intron tracking (SMIT) measures co-transcriptional splicing kinetics.
(A) SMIT workflow: Nascent RNA is purified from chromatin (intron, red; exons, black). Nascent RNA molecules of interest are selected by PCR with a forward primer in exon 1. Pol II position (3’ end) and splicing state are determined by paired-end sequencing. Single molecule observations are corrected for PCR length bias, grouped by Pol II position and the fraction spliced is calculated. Saturation values (cyan), defining a statistically determined maximum value, allow calculation of ½ max Pol II positions (50% of saturation, magenta). For details see SI.
(B) SMIT profiles for three representative endogenous genes. Fraction spliced (mean ± SD) is plotted versus distance from 3’ splice sites (SSs). Co-transcriptional splicing saturation value (cyan dotted line), half-saturation Pol II position (magenta dotted line) and polyA site (grey dotted line, if in range) are indicated.
See Figures S1-S3 for characterization of SMIT and additional SMIT profiles.

