
Fig. 2.
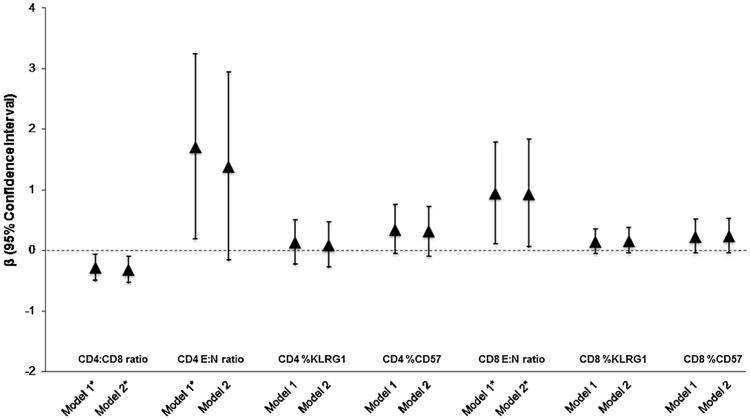
Covariate-adjusted associations between Lifetime PTSD and the distribution of T cell phenotypes among 85 participants in the Detroit Neighborhood Health Study. Abbreviations: PTSD, posttraumatic stress disorder; E:N ratio, ratio of end-stage non-proliferative effector cells (E; CCR7-CD45RA+CD27-CD28-orTEMRA) to naïve T-cells (N; CCR7+CD45RA+CD27+CD28 +).
*P value <0.05.
aModel 1: Association between PTSD and T-cell outcome adjusted for age, gender, race/ethnicity, and education.
bModel 2: Association between PTSD and T-cell outcome additionally adjusted for smoking status and medication use. 3 individuals missing data on medication use were excluded from the model.