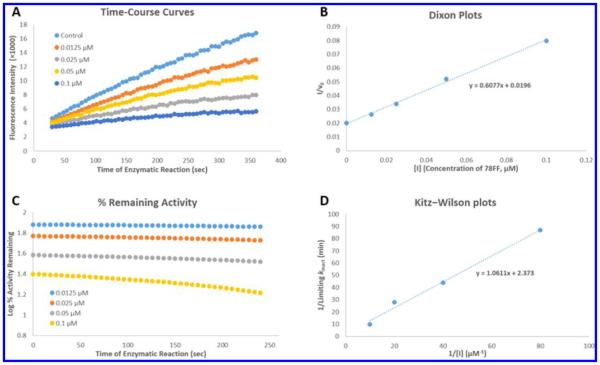
Figure 4.
(A) Production of resorufin by P450 1A2 in the absence (control) and presence of 0.0125, 0.025, 0.05, and 0.1 μM 78FF (3). The fluorescent product formation (resorufin anion) was monitored continuously over 6 min as described in the Experimental Section. 78FF inhibited the production of resorufin in a concentration-dependent manner, and the second-order product formation curves (y = ax2 + bx + c) were obtained using the Trendline tool of the Microsoft Excel program. The differential curve (y = 2ax + b) of each product formation curve represents the instantaneous enzymatic activity (v). (B) Dixon plots (1/v0 vs [I]). The first-order coefficient b in the above second-order equations in graph A represents enzymatic activity (v0) at the beginning of the enzymatic reaction. Dixon plots were used (by plotting the reciprocals of the enzymatic activity (1/v0) vs inhibitor concentrations [I]) to determine Ki values (x-intercepts) for the inhibitors. In this case, the Ki value of 78FF in inhibition of P450 1A2 was 0.45 μM. (C) Time- and concentration-dependent inhibition of P450 1A2-dependent MROD activity by 78FF. The enzymatic activity values were calculated through the first-order derivatives (y = 2ax + b) of the product formation curves at different times, and the percentages of activity remaining was obtained according to the formula (Ainhibitor/Acontrol)%. The activity loss with time indicates the time-dependent inhibition of P450 1A2 by 78FF. (D) Kitz–Wilson plots (1/kinact vs 1/[I]). kinact values were obtained using the curves in graph C as described in the Experimental Section, and [I] values were the final concentrations of 78FF. In this case, the final concentrations were 0.0125, 0.025, 0.05, and 0.1 μM. According to the linear equation shown in this graph, KI and limiting kinact values were calculated, respectively.

