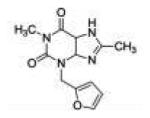
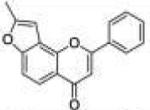
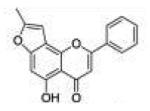
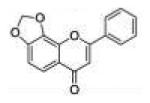
Table 1.
Inhibitory Activity and Selectivity of Flavone Derivatives toward P450 1A2a
| Compound | Short Name |
Structure | Ki (μM) | Selective Index (SI) |
|||
|---|---|---|---|---|---|---|---|
| 1A1 | 1A2 | 1B1 | 1A1/1A2 | 1B1/1A2 | |||
| Furafylline |

|
>200 | 68.0 ±13.2 |
>200 | >2.9 | >2.9 | |
| α-Naphtho flavone |
αNF |

|
0.045 ±0.010 |
0.020 ±0.005 |
0.016 ±0.002 |
2.3 | 0.8 |
| 2 | 78PF |

|
0.27 ±0.02 |
0.058 ±0.018 |
0.053 ±0.032 |
4.7 | 0.9 |
| 3 | 78FF |

|
0.43 ±0.19 |
0.030 ±0.002 |
0.18 ±0.05 |
14 | 6.0 |
| 5 | 5H78PF |

|
0.11 ±0.02 |
0.014 ±0.004 |
0.0056 ±0.0020 |
7.9 | 0.4 |
| 8 | 5H78FF |

|
0.47 ±0.12 |
0.044 ±0.023 |
0.10 ±0.06 |
11 | 2.3 |
| 11 | 78PyF |

|
0.040 ±0.008 |
0.076 ±0.011 |
0.12 ±0.02 |
0.5 | 1.8 |
| 12 | 78DOF |

|
1.23 ±0.22 |
0.090 ±0.034 |
0.48 ±0.21 |
14 | 5.3 |
The Ki values are represented as the mean ± SD μM of three independent experiments.
