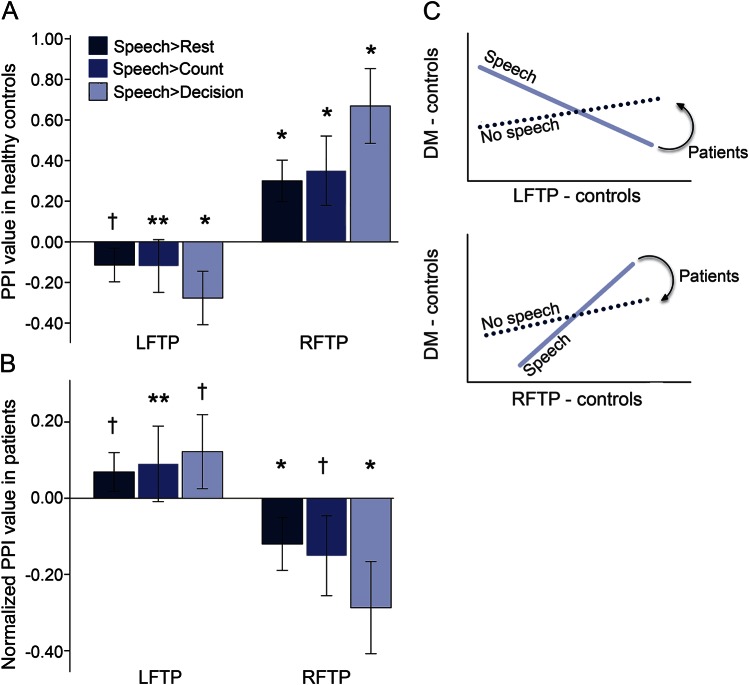
Figure 3. Speech-related psychophysiological interactions (PPIs) between the left fronto-temporo-parietal network (LFTP) and right fronto-temporo-parietal network (RFTP) with the default mode network (DMN).
Error bars represent 95% confidence intervals. The 3 shades of tone for the bars represent the PPI values contrasting speech against the different baselines. (A) Controls demonstrated a negative PPI for the LFTP network, reflecting an increase in trial-by-trial negative correlation between the LFTP and DMN during speech > baseline tasks. The opposite occurred with the RFTP network; speech > any baseline increased its functional connectivity with the DMN. (B) Patients demonstrated an increase in the normalized PPI for the LFTP (a positive normalized PPI) and a decrease for the RFTP (a negative normalized PPI) compared to controls. Zero on the Y axis represents the mean values for controls. (C) Illustration of the relationship between the LFTP and DMN (top) and RFTP and DMN (bottom). Shaded lines represent the task-independent connectivity between the 2 networks. Solid line represents the speech task-specific functional connectivity in the controls. Curved arrows represent the direction of significant change in the PPI in the patients. When the patients performed the speech task, the normal trial-by-trial negative correlation between the LFTP and DMN was significantly reversed. Likewise, the normal correlation between the RFTP and the DMN during speech was also significantly reversed. **p = 0.07; †p < 0.05; *p ≤ 0.001; post hoc 2-tailed t tests.

