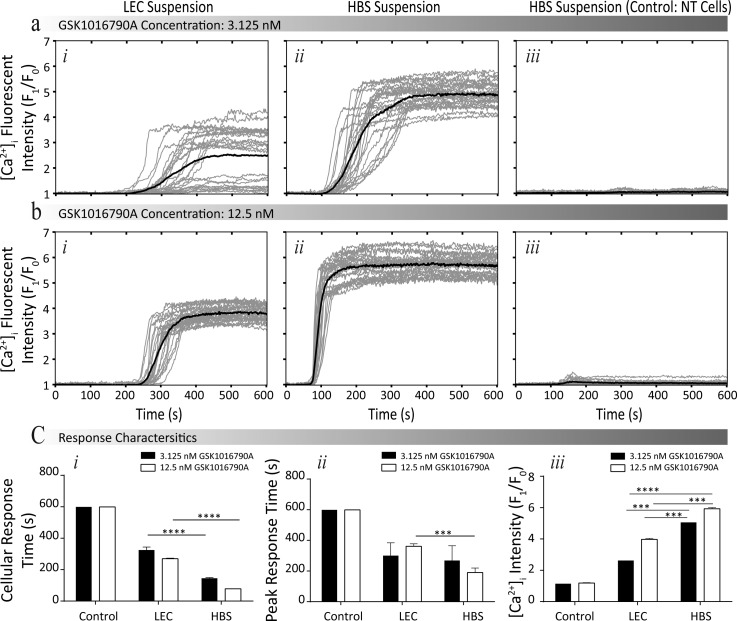
FIG. 2.
Comparing the influence of LEC and HBS suspensions, in regard to the intracellular calcium signalling of HEK-293-TRPV4 cells. (a) and (b) Normalised intensity profiles at different concentrations of GSK1016790A (3.125 nM and 12.5 nM, respectively), conducted for HEK-293-TRPV4 cells suspended in (i) LEC, (ii) HEPES, and (iii) NT HEK-293 cells suspended in HEPES (Negative control) (see supplementary material S3 for experimental fluorescent images).46 (c) Comparing the response characteristics: (i) cellular and (ii) peak response times, and (iii) pharmacological efficacy of cells suspended in different buffers. Data are presented as the mean ± SEM, ***P < 0.001, and ****P < 0.0001.

