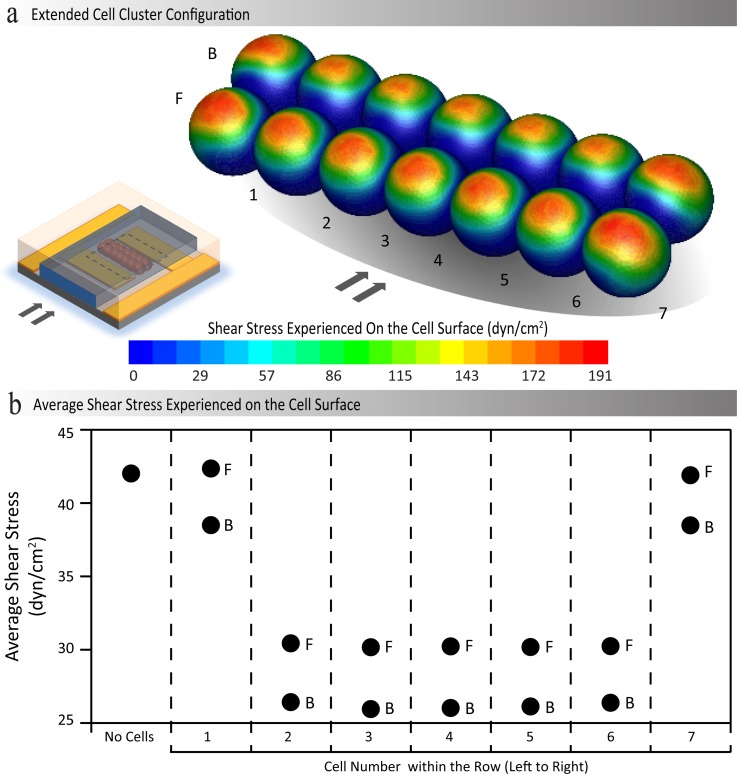
FIG. 4.
(a) Contours of shear stress exerted over a cluster of immobilised HEK-293 cells, obtained through numerical stimulations when a flow rate of 120 μl/min is applied through the microchannel. (b) The values of average shear stress exerted on different cells within the cluster. F and B are used to denote the front and back rows of the cluster, respectively; in addition, 1 to 7 are used to denote the location of the cell in the row from left to right.

